Investment fund shares/units (Bond Funds Balance Sheet) - ekonomika ČNB
Aktualizace dat Investment fund shares/units (Bond Funds Balance Sheet) v této aplikaci skončila 30.6.2023. Aktualizovná data časových řad najdete na stránkách nové aplikace z dat ARAD ČNB
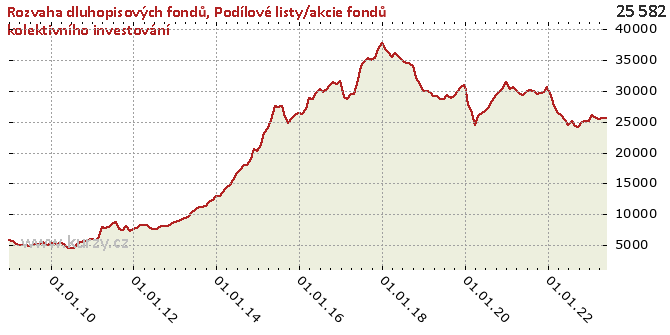
Graf hodnot, Bond Funds Balance Sheet
Meziroční srovnání
Minima a maxima
| Typ | Období | Hodnota |
|---|---|---|
| Max | 31.12.2017 | 37 847.80 |
| Min | 31.05.2010 | 4 437.90 |
Historické hodnoty
| Období | Hodnota | Předchozí | Rozdíl | Změna | Před rokem | Rozdíl | Změna |
|---|---|---|---|---|---|---|---|
| 30.06.2020 | 26 752.37 | 26 383.33 | 369.04 | 1.40% | 28 699.75 | -1 947.38 | -6.79% |
| 31.05.2020 | 26 383.33 | 25 878.82 | 504.51 | 1.95% | 28 657.30 | -2 273.97 | -7.93% |
| 30.04.2020 | 25 878.82 | 24 498.61 | 1 380.21 | 5.63% | 29 179.33 | -3 300.51 | -11.31% |
| 31.03.2020 | 24 498.61 | 26 951.25 | -2 452.64 | -9.10% | 29 168.14 | -4 669.53 | -16.01% |
| 29.02.2020 | 26 951.25 | 27 641.92 | - 690.67 | -2.50% | 29 844.10 | -2 892.85 | -9.69% |
| 31.01.2020 | 27 641.92 | 31 024.73 | -3 382.81 | -10.90% | 30 044.33 | -2 402.41 | -8.00% |
| 31.12.2019 | 31 024.73 | 30 612.88 | 411.86 | 1.35% | 29 958.13 | 1 066.60 | 3.56% |
| 30.11.2019 | 30 612.88 | 30 037.73 | 575.15 | 1.91% | 31 056.87 | - 444.00 | -1.43% |
| 31.10.2019 | 30 037.73 | 29 120.97 | 916.76 | 3.15% | 32 112.84 | -2 075.11 | -6.46% |
| 30.09.2019 | 29 120.97 | 28 830.04 | 290.93 | 1.01% | 34 111.56 | -4 990.59 | -14.63% |
| 31.08.2019 | 28 830.04 | 29 289.41 | - 459.37 | -1.57% | 34 574.68 | -5 744.64 | -16.62% |
| 31.07.2019 | 29 289.41 | 28 699.75 | 589.66 | 2.05% | 34 567.09 | -5 277.68 | -15.27% |
| 30.06.2019 | 28 699.75 | 28 657.30 | 42.45 | 0.15% | 34 995.53 | -6 295.77 | -17.99% |
| 31.05.2019 | 28 657.30 | 29 179.33 | - 522.03 | -1.79% | 35 587.69 | -6 930.40 | -19.47% |
| 30.04.2019 | 29 179.33 | 29 168.14 | 11.18 | 0.04% | 36 183.99 | -7 004.66 | -19.36% |
| 31.03.2019 | 29 168.14 | 29 844.10 | - 675.96 | -2.26% | 35 575.64 | -6 407.49 | -18.01% |
| 28.02.2019 | 29 844.10 | 30 044.33 | - 200.23 | -0.67% | 36 302.88 | -6 458.77 | -17.79% |
| 31.01.2019 | 30 044.33 | 29 958.13 | 86.20 | 0.29% | 36 858.04 | -6 813.71 | -18.49% |
| 31.12.2018 | 29 958.13 | 31 056.87 | -1 098.74 | -3.54% | 37 847.80 | -7 889.67 | -20.85% |
| 30.11.2018 | 31 056.87 | 32 112.84 | -1 055.97 | -3.29% | 36 851.73 | -5 794.86 | -15.72% |
| 31.10.2018 | 32 112.84 | 34 111.56 | -1 998.72 | -5.86% | 35 275.21 | -3 162.37 | -8.96% |
| 30.09.2018 | 34 111.56 | 34 574.68 | - 463.13 | -1.34% | 35 048.32 | - 936.76 | -2.67% |
| 31.08.2018 | 34 574.68 | 34 567.09 | 7.60 | 0.02% | 35 403.41 | - 828.73 | -2.34% |
| 31.07.2018 | 34 567.09 | 34 995.53 | - 428.44 | -1.22% | 34 768.02 | - 200.94 | -0.58% |
| 30.06.2018 | 34 995.53 | 35 587.69 | - 592.17 | -1.66% | 34 066.72 | 928.80 | 2.73% |
| 31.05.2018 | 35 587.69 | 36 183.99 | - 596.30 | -1.65% | 31 770.15 | 3 817.54 | 12.02% |
| 30.04.2018 | 36 183.99 | 35 575.64 | 608.35 | 1.71% | 29 533.08 | 6 650.91 | 22.52% |
| 31.03.2018 | 35 575.64 | 36 302.88 | - 727.24 | -2.00% | 29 494.26 | 6 081.38 | 20.62% |
| 28.02.2018 | 36 302.88 | 36 858.04 | - 555.16 | -1.51% | 28 650.42 | 7 652.46 | 26.71% |
| 31.01.2018 | 36 858.04 | 37 847.80 | - 989.77 | -2.62% | 29 032.70 | 7 825.33 | 26.95% |
| 31.12.2017 | 37 847.80 | 36 851.73 | 996.07 | 2.70% | 31 631.97 | 6 215.83 | 19.65% |
| 30.11.2017 | 36 851.73 | 35 275.21 | 1 576.52 | 4.47% | 31 146.26 | 5 705.47 | 18.32% |
| 31.10.2017 | 35 275.21 | 35 048.32 | 226.89 | 0.65% | 31 417.73 | 3 857.48 | 12.28% |
| 30.09.2017 | 35 048.32 | 35 403.41 | - 355.09 | -1.00% | 30 988.15 | 4 060.17 | 13.10% |
| 31.08.2017 | 35 403.41 | 34 768.02 | 635.39 | 1.83% | 30 394.35 | 5 009.06 | 16.48% |
| 31.07.2017 | 34 768.02 | 34 066.72 | 701.30 | 2.06% | 29 869.39 | 4 898.63 | 16.40% |
| 30.06.2017 | 34 066.72 | 31 770.15 | 2 296.57 | 7.23% | 30 275.72 | 3 791.00 | 12.52% |
| 31.05.2017 | 31 770.15 | 29 533.08 | 2 237.07 | 7.57% | 29 723.92 | 2 046.24 | 6.88% |
| 30.04.2017 | 29 533.08 | 29 494.26 | 38.82 | 0.13% | 28 734.54 | 798.54 | 2.78% |
| 31.03.2017 | 29 494.26 | 28 650.42 | 843.84 | 2.95% | 28 877.67 | 616.59 | 2.14% |
| 28.02.2017 | 28 650.42 | 29 032.70 | - 382.29 | -1.32% | 27 038.40 | 1 612.01 | 5.96% |
| 31.01.2017 | 29 032.70 | 31 631.97 | -2 599.27 | -8.22% | 26 189.84 | 2 842.86 | 10.85% |
| 31.12.2016 | 31 631.97 | 31 146.26 | 485.71 | 1.56% | 26 481.70 | 5 150.27 | 19.45% |
| 30.11.2016 | 31 146.26 | 31 417.73 | - 271.47 | -0.86% | 26 048.43 | 5 097.83 | 19.57% |
| 31.10.2016 | 31 417.73 | 30 988.15 | 429.57 | 1.39% | 25 686.16 | 5 731.56 | 22.31% |
| 30.09.2016 | 30 988.15 | 30 394.35 | 593.80 | 1.95% | 24 837.44 | 6 150.72 | 24.76% |
| 31.08.2016 | 30 394.35 | 29 869.39 | 524.96 | 1.76% | 25 827.49 | 4 566.86 | 17.68% |
| 31.07.2016 | 29 869.39 | 30 275.72 | - 406.33 | -1.34% | 27 485.60 | 2 383.79 | 8.67% |
| 30.06.2016 | 30 275.72 | 29 723.92 | 551.81 | 1.86% | 27 419.53 | 2 856.19 | 10.42% |
| 31.05.2016 | 29 723.92 | 28 734.54 | 989.37 | 3.44% | 27 513.10 | 2 210.81 | 8.04% |
| 30.04.2016 | 28 734.54 | 28 877.67 | - 143.12 | -0.50% | 25 241.83 | 3 492.72 | 13.84% |
| 31.03.2016 | 28 877.67 | 27 038.40 | 1 839.26 | 6.80% | 24 033.39 | 4 844.28 | 20.16% |
| 29.02.2016 | 27 038.40 | 26 189.84 | 848.56 | 3.24% | 23 117.76 | 3 920.64 | 16.96% |
| 31.01.2016 | 26 189.84 | 26 481.70 | - 291.86 | -1.10% | 21 216.86 | 4 972.98 | 23.44% |
| 31.12.2015 | 26 481.70 | 26 048.43 | 433.28 | 1.66% | 20 268.08 | 6 213.62 | 30.66% |
| 30.11.2015 | 26 048.43 | 25 686.16 | 362.27 | 1.41% | 20 521.16 | 5 527.27 | 26.93% |
| 31.10.2015 | 25 686.16 | 24 837.44 | 848.73 | 3.42% | 18 956.70 | 6 729.46 | 35.50% |
| 30.09.2015 | 24 837.44 | 25 827.49 | - 990.05 | -3.83% | 18 025.43 | 6 812.01 | 37.79% |
| 31.08.2015 | 25 827.49 | 27 485.60 | -1 658.11 | -6.03% | 18 022.99 | 7 804.50 | 43.30% |
| 31.07.2015 | 27 485.60 | 27 419.53 | 66.06 | 0.24% | 17 229.24 | 10 256.36 | 59.53% |
| 30.06.2015 | 27 419.53 | 27 513.10 | -93.57 | -0.34% | 16 639.97 | 10 779.57 | 64.78% |
| 31.05.2015 | 27 513.10 | 25 241.83 | 2 271.27 | 9.00% | 15 565.35 | 11 947.75 | 76.76% |
| 30.04.2015 | 25 241.83 | 24 033.39 | 1 208.44 | 5.03% | 14 788.63 | 10 453.20 | 70.68% |
| 31.03.2015 | 24 033.39 | 23 117.76 | 915.63 | 3.96% | 14 179.80 | 9 853.58 | 69.49% |
| 28.02.2015 | 23 117.76 | 21 216.86 | 1 900.90 | 8.96% | 13 589.60 | 9 528.16 | 70.11% |
| 31.01.2015 | 21 216.86 | 20 268.08 | 948.78 | 4.68% | 13 004.34 | 8 212.51 | 63.15% |
| 31.12.2014 | 20 268.08 | 20 521.16 | - 253.08 | -1.23% | 12 889.50 | 7 378.58 | 57.24% |
| 30.11.2014 | 20 521.16 | 18 956.70 | 1 564.46 | 8.25% | 12 246.24 | 8 274.92 | 67.57% |
| 31.10.2014 | 18 956.70 | 18 025.43 | 931.27 | 5.17% | 11 907.98 | 7 048.72 | 59.19% |
| 30.09.2014 | 18 025.43 | 18 022.99 | 2.44 | 0.01% | 11 336.59 | 6 688.84 | 59.00% |
| 31.08.2014 | 18 022.99 | 17 229.24 | 793.75 | 4.61% | 11 171.17 | 6 851.81 | 61.33% |
| 31.07.2014 | 17 229.24 | 16 639.97 | 589.27 | 3.54% | 11 079.75 | 6 149.48 | 55.50% |
| 30.06.2014 | 16 639.97 | 15 565.35 | 1 074.62 | 6.90% | 10 649.02 | 5 990.95 | 56.26% |
| 31.05.2014 | 15 565.35 | 14 788.63 | 776.72 | 5.25% | 10 269.81 | 5 295.54 | 51.56% |
| 30.04.2014 | 14 788.63 | 14 179.80 | 608.82 | 4.29% | 9 505.62 | 5 283.00 | 55.58% |
| 31.03.2014 | 14 179.80 | 13 589.60 | 590.21 | 4.34% | 9 335.60 | 4 844.21 | 51.89% |
| 28.02.2014 | 13 589.60 | 13 004.34 | 585.25 | 4.50% | 9 022.80 | 4 566.80 | 50.61% |
| 31.01.2014 | 13 004.34 | 12 889.50 | 114.85 | 0.89% | 8 845.55 | 4 158.80 | 47.02% |
| 31.12.2013 | 12 889.50 | 12 246.24 | 643.26 | 5.25% | 8 788.35 | 4 101.15 | 46.67% |
| 30.11.2013 | 12 246.24 | 11 907.98 | 338.26 | 2.84% | 8 443.10 | 3 803.14 | 45.04% |
| 31.10.2013 | 11 907.98 | 11 336.59 | 571.39 | 5.04% | 8 114.87 | 3 793.11 | 46.74% |
| 30.09.2013 | 11 336.59 | 11 171.17 | 165.42 | 1.48% | 8 154.50 | 3 182.09 | 39.02% |
| 31.08.2013 | 11 171.17 | 11 079.75 | 91.42 | 0.83% | 8 104.18 | 3 067.00 | 37.84% |
| 31.07.2013 | 11 079.75 | 10 649.02 | 430.73 | 4.04% | 7 563.06 | 3 516.69 | 46.50% |
| 30.06.2013 | 10 649.02 | 10 269.81 | 379.21 | 3.69% | 7 558.88 | 3 090.14 | 40.88% |
| 31.05.2013 | 10 269.81 | 9 505.62 | 764.18 | 8.04% | 7 820.67 | 2 449.14 | 31.32% |
| 30.04.2013 | 9 505.62 | 9 335.60 | 170.03 | 1.82% | 8 196.29 | 1 309.34 | 15.97% |
| 31.03.2013 | 9 335.60 | 9 022.80 | 312.80 | 3.47% | 8 277.41 | 1 058.19 | 12.78% |
| 28.02.2013 | 9 022.80 | 8 845.55 | 177.25 | 2.00% | 8 161.51 | 861.29 | 10.55% |
| 31.01.2013 | 8 845.55 | 8 788.35 | 57.20 | 0.65% | 7 772.26 | 1 073.29 | 13.81% |
| 31.12.2012 | 8 788.35 | 8 443.10 | 345.25 | 4.09% | 7 553.07 | 1 235.27 | 16.35% |
| 30.11.2012 | 8 443.10 | 8 114.87 | 328.23 | 4.04% | 7 277.06 | 1 166.04 | 16.02% |
| 31.10.2012 | 8 114.87 | 8 154.50 | -39.63 | -0.49% | 8 071.41 | 43.46 | 0.54% |
| 30.09.2012 | 8 154.50 | 8 104.18 | 50.32 | 0.62% | 7 438.65 | 715.86 | 9.62% |
| 31.08.2012 | 8 104.18 | 7 563.06 | 541.12 | 7.15% | 7 558.71 | 545.47 | 7.22% |
| 31.07.2012 | 7 563.06 | 7 558.88 | 4.18 | 0.06% | 8 681.22 | -1 118.16 | -12.88% |
| 30.06.2012 | 7 558.88 | 7 820.67 | - 261.79 | -3.35% | 8 370.72 | - 811.84 | -9.70% |
| 31.05.2012 | 7 820.67 | 8 196.29 | - 375.62 | -4.58% | 7 953.91 | - 133.24 | -1.68% |
| 30.04.2012 | 8 196.29 | 8 277.41 | -81.12 | -0.98% | 7 807.30 | 388.99 | 4.98% |
| 31.03.2012 | 8 277.41 | 8 161.51 | 115.90 | 1.42% | 7 954.08 | 323.33 | 4.06% |
| 29.02.2012 | 8 161.51 | 7 772.26 | 389.25 | 5.01% | 5 915.70 | 2 245.80 | 37.96% |
| 31.01.2012 | 7 772.26 | 7 553.07 | 219.18 | 2.90% | 5 878.67 | 1 893.58 | 32.21% |
| 31.12.2011 | 7 553.07 | 7 277.06 | 276.01 | 3.79% | 5 921.76 | 1 631.32 | 27.55% |
| 30.11.2011 | 7 277.06 | 8 071.41 | - 794.35 | -9.84% | 5 841.59 | 1 435.48 | 24.57% |
| 31.10.2011 | 8 071.41 | 7 438.65 | 632.76 | 8.51% | 5 673.05 | 2 398.36 | 42.28% |
| 30.09.2011 | 7 438.65 | 7 558.71 | - 120.06 | -1.59% | 5 533.01 | 1 905.63 | 34.44% |
| 31.08.2011 | 7 558.71 | 8 681.22 | -1 122.51 | -12.93% | 5 286.50 | 2 272.20 | 42.98% |
| 31.07.2011 | 8 681.22 | 8 370.72 | 310.50 | 3.71% | 4 535.57 | 4 145.65 | 91.40% |
| 30.06.2011 | 8 370.72 | 7 953.91 | 416.81 | 5.24% | 4 467.78 | 3 902.94 | 87.36% |
| 31.05.2011 | 7 953.91 | 7 807.30 | 146.62 | 1.88% | 4 437.90 | 3 516.01 | 79.23% |
| 30.04.2011 | 7 807.30 | 7 954.08 | - 146.78 | -1.85% | 5 141.62 | 2 665.68 | 51.85% |
| 31.03.2011 | 7 954.08 | 5 915.70 | 2 038.38 | 34.46% | 5 315.61 | 2 638.47 | 49.64% |
| 28.02.2011 | 5 915.70 | 5 878.67 | 37.03 | 0.63% | 5 185.60 | 730.11 | 14.08% |
| 31.01.2011 | 5 878.67 | 5 921.76 | -43.09 | -0.73% | 5 267.23 | 611.45 | 11.61% |
| 31.12.2010 | 5 921.76 | 5 841.59 | 80.17 | 1.37% | 5 171.65 | 750.11 | 14.50% |
| 30.11.2010 | 5 841.59 | 5 673.05 | 168.54 | 2.97% | 5 003.16 | 838.42 | 16.76% |
| 31.10.2010 | 5 673.05 | 5 533.01 | 140.03 | 2.53% | 5 399.02 | 274.03 | 5.08% |
| 30.09.2010 | 5 533.01 | 5 286.50 | 246.51 | 4.66% | 5 166.21 | 366.80 | 7.10% |
| 31.08.2010 | 5 286.50 | 4 535.57 | 750.93 | 16.56% | 5 118.69 | 167.81 | 3.28% |
| 31.07.2010 | 4 535.57 | 4 467.78 | 67.79 | 1.52% | 5 080.13 | - 544.56 | -10.72% |
| 30.06.2010 | 4 467.78 | 4 437.90 | 29.88 | 0.67% | 4 777.64 | - 309.86 | -6.49% |
| 31.05.2010 | 4 437.90 | 5 141.62 | - 703.72 | -13.69% | 5 048.31 | - 610.40 | -12.09% |
| 30.04.2010 | 5 141.62 | 5 315.61 | - 173.99 | -3.27% | 4 959.73 | 181.89 | 3.67% |
| 31.03.2010 | 5 315.61 | 5 185.60 | 130.01 | 2.51% | 4 949.87 | 365.74 | 7.39% |
| 28.02.2010 | 5 185.60 | 5 267.23 | -81.63 | -1.55% | 5 106.36 | 79.24 | 1.55% |
| 31.01.2010 | 5 267.23 | 5 171.65 | 95.58 | 1.85% | 5 610.31 | - 343.08 | -6.12% |
| 31.12.2009 | 5 171.65 | 5 003.16 | 168.48 | 3.37% | 5 790.46 | - 618.82 | -10.69% |
| 30.11.2009 | 5 003.16 | 5 399.02 | - 395.86 | -7.33% | - | - | - |
| 31.10.2009 | 5 399.02 | 5 166.21 | 232.81 | 4.51% | - | - | - |
| 30.09.2009 | 5 166.21 | 5 118.69 | 47.52 | 0.93% | - | - | - |
| 31.08.2009 | 5 118.69 | 5 080.13 | 38.56 | 0.76% | - | - | - |
| 31.07.2009 | 5 080.13 | 4 777.64 | 302.49 | 6.33% | - | - | - |
| 30.06.2009 | 4 777.64 | 5 048.31 | - 270.66 | -5.36% | - | - | - |
| 31.05.2009 | 5 048.31 | 4 959.73 | 88.58 | 1.79% | - | - | - |
| 30.04.2009 | 4 959.73 | 4 949.87 | 9.86 | 0.20% | - | - | - |
| 31.03.2009 | 4 949.87 | 5 106.36 | - 156.49 | -3.06% | - | - | - |
| 28.02.2009 | 5 106.36 | 5 610.31 | - 503.95 | -8.98% | - | - | - |
| 31.01.2009 | 5 610.31 | 5 790.46 | - 180.16 | -3.11% | - | - | - |
| 31.12.2008 | 5 790.46 | - | - | - | - | - | - |
Graf jako obrázek

Podobné sestavy
Aplikace Ekonomika ČNB ze sekce makroekonomika zobrazuje časové řady hlavních makroekonomických údajů z ekonomiky ČR. Najdete zde přes 10.000 grafů různých hodnot od úrokových sazeb, přes statistiky státního rozpočtu, statistiky ČNB a data zpracovávaná ČSÚ. Data jsou k dispozici obvykle za posledních více než 20 let, od prosince roku 1992. Zdroj dat: ČNB ARAD

