110. Crop output (except fruits and vegetables) - ekonomika ČNB
Aktualizace dat 110. Crop output (except fruits and vegetables) v této aplikaci skončila 30.6.2023. Aktualizovná data časových řad najdete na stránkách nové aplikace z dat ARAD ČNB
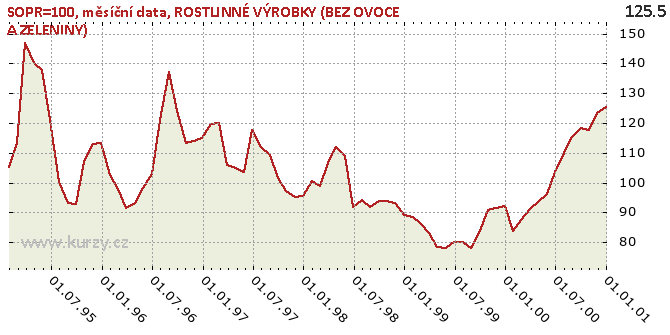
Graf hodnot, y-o-y indices, monthly data
Meziroční srovnání
Minima a maxima
| Typ | Období | Hodnota |
|---|---|---|
| Min | 31.08.1999 | 77.90 |
| Max | 31.03.1995 | 147.00 |
Historické hodnoty
| Období | Hodnota | Předchozí | Rozdíl | Změna | Před rokem | Rozdíl | Změna |
|---|---|---|---|---|---|---|---|
| 31.12.2000 | 125.50 | 123.50 | 2.00 | 1.62% | 92.00 | 33.50 | 36.41% |
| 30.11.2000 | 123.50 | 117.70 | 5.80 | 4.93% | 91.60 | 31.90 | 34.83% |
| 31.10.2000 | 117.70 | 118.20 | -0.50 | -0.42% | 90.90 | 26.80 | 29.48% |
| 30.09.2000 | 118.20 | 115.40 | 2.80 | 2.43% | 83.00 | 35.20 | 42.41% |
| 31.08.2000 | 115.40 | 109.90 | 5.50 | 5.00% | 77.90 | 37.50 | 48.14% |
| 31.07.2000 | 109.90 | 103.70 | 6.20 | 5.98% | 79.90 | 30.00 | 37.55% |
| 30.06.2000 | 103.70 | 96.10 | 7.60 | 7.91% | 79.90 | 23.80 | 29.79% |
| 31.05.2000 | 96.10 | 93.60 | 2.50 | 2.67% | 78.00 | 18.10 | 23.21% |
| 30.04.2000 | 93.60 | 91.00 | 2.60 | 2.86% | 78.50 | 15.10 | 19.24% |
| 31.03.2000 | 91.00 | 87.60 | 3.40 | 3.88% | 83.00 | 8.00 | 9.64% |
| 29.02.2000 | 87.60 | 83.60 | 4.00 | 4.78% | 86.50 | 1.10 | 1.27% |
| 31.01.2000 | 83.60 | 92.00 | -8.40 | -9.13% | 88.60 | -5.00 | -5.64% |
| 31.12.1999 | 92.00 | 91.60 | 0.40 | 0.44% | 89.00 | 3.00 | 3.37% |
| 30.11.1999 | 91.60 | 90.90 | 0.70 | 0.77% | 93.20 | -1.60 | -1.72% |
| 31.10.1999 | 90.90 | 83.00 | 7.90 | 9.52% | 93.90 | -3.00 | -3.19% |
| 30.09.1999 | 83.00 | 77.90 | 5.10 | 6.55% | 93.70 | -10.70 | -11.42% |
| 31.08.1999 | 77.90 | 79.90 | -2.00 | -2.50% | 91.90 | -14.00 | -15.23% |
| 31.07.1999 | 79.90 | 79.90 | 0.00 | 0.00 | 94.10 | -14.20 | -15.09% |
| 30.06.1999 | 79.90 | 78.00 | 1.90 | 2.44% | 91.90 | -12.00 | -13.06% |
| 31.05.1999 | 78.00 | 78.50 | -0.50 | -0.64% | 109.00 | -31.00 | -28.44% |
| 30.04.1999 | 78.50 | 83.00 | -4.50 | -5.42% | 111.80 | -33.30 | -29.79% |
| 31.03.1999 | 83.00 | 86.50 | -3.50 | -4.05% | 106.50 | -23.50 | -22.07% |
| 28.02.1999 | 86.50 | 88.60 | -2.10 | -2.37% | 98.90 | -12.40 | -12.54% |
| 31.01.1999 | 88.60 | 89.00 | -0.40 | -0.45% | 100.70 | -12.10 | -12.02% |
| 31.12.1998 | 89.00 | 93.20 | -4.20 | -4.51% | 95.50 | -6.50 | -6.81% |
| 30.11.1998 | 93.20 | 93.90 | -0.70 | -0.75% | 95.10 | -1.90 | -2.00% |
| 31.10.1998 | 93.90 | 93.70 | 0.20 | 0.21% | 97.20 | -3.30 | -3.40% |
| 30.09.1998 | 93.70 | 91.90 | 1.80 | 1.96% | 101.40 | -7.70 | -7.59% |
| 31.08.1998 | 91.90 | 94.10 | -2.20 | -2.34% | 109.40 | -17.50 | -16.00% |
| 31.07.1998 | 94.10 | 91.90 | 2.20 | 2.39% | 111.80 | -17.70 | -15.83% |
| 30.06.1998 | 91.90 | 109.00 | -17.10 | -15.69% | 117.70 | -25.80 | -21.92% |
| 31.05.1998 | 109.00 | 111.80 | -2.80 | -2.50% | 103.60 | 5.40 | 5.21% |
| 30.04.1998 | 111.80 | 106.50 | 5.30 | 4.98% | 104.80 | 7.00 | 6.68% |
| 31.03.1998 | 106.50 | 98.90 | 7.60 | 7.68% | 106.00 | 0.50 | 0.47% |
| 28.02.1998 | 98.90 | 100.70 | -1.80 | -1.79% | 120.00 | -21.10 | -17.58% |
| 31.01.1998 | 100.70 | 95.50 | 5.20 | 5.45% | 119.80 | -19.10 | -15.94% |
| 31.12.1997 | 95.50 | 95.10 | 0.40 | 0.42% | 114.80 | -19.30 | -16.81% |
| 30.11.1997 | 95.10 | 97.20 | -2.10 | -2.16% | 113.90 | -18.80 | -16.51% |
| 31.10.1997 | 97.20 | 101.40 | -4.20 | -4.14% | 113.20 | -16.00 | -14.13% |
| 30.09.1997 | 101.40 | 109.40 | -8.00 | -7.31% | 124.00 | -22.60 | -18.23% |
| 31.08.1997 | 109.40 | 111.80 | -2.40 | -2.15% | 137.10 | -27.70 | -20.20% |
| 31.07.1997 | 111.80 | 117.70 | -5.90 | -5.01% | 120.90 | -9.10 | -7.53% |
| 30.06.1997 | 117.70 | 103.60 | 14.10 | 13.61% | 103.00 | 14.70 | 14.27% |
| 31.05.1997 | 103.60 | 104.80 | -1.20 | -1.15% | 98.10 | 5.50 | 5.61% |
| 30.04.1997 | 104.80 | 106.00 | -1.20 | -1.13% | 93.20 | 11.60 | 12.45% |
| 31.03.1997 | 106.00 | 120.00 | -14.00 | -11.67% | 91.50 | 14.50 | 15.85% |
| 28.02.1997 | 120.00 | 119.80 | 0.20 | 0.17% | 98.00 | 22.00 | 22.45% |
| 31.01.1997 | 119.80 | 114.80 | 5.00 | 4.36% | 102.70 | 17.10 | 16.65% |
| 31.12.1996 | 114.80 | 113.90 | 0.90 | 0.79% | 113.40 | 1.40 | 1.23% |
| 30.11.1996 | 113.90 | 113.20 | 0.70 | 0.62% | 113.10 | 0.80 | 0.71% |
| 31.10.1996 | 113.20 | 124.00 | -10.80 | -8.71% | 106.80 | 6.40 | 5.99% |
| 30.09.1996 | 124.00 | 137.10 | -13.10 | -9.55% | 92.70 | 31.30 | 33.76% |
| 31.08.1996 | 137.10 | 120.90 | 16.20 | 13.40% | 93.20 | 43.90 | 47.10% |
| 31.07.1996 | 120.90 | 103.00 | 17.90 | 17.38% | 100.10 | 20.80 | 20.78% |
| 30.06.1996 | 103.00 | 98.10 | 4.90 | 4.99% | 121.00 | -18.00 | -14.88% |
| 31.05.1996 | 98.10 | 93.20 | 4.90 | 5.26% | 137.90 | -39.80 | -28.86% |
| 30.04.1996 | 93.20 | 91.50 | 1.70 | 1.86% | 140.20 | -47.00 | -33.52% |
| 31.03.1996 | 91.50 | 98.00 | -6.50 | -6.63% | 147.00 | -55.50 | -37.76% |
| 29.02.1996 | 98.00 | 102.70 | -4.70 | -4.58% | 113.30 | -15.30 | -13.50% |
| 31.01.1996 | 102.70 | 113.40 | -10.70 | -9.44% | 105.40 | -2.70 | -2.56% |
| 31.12.1995 | 113.40 | 113.10 | 0.30 | 0.27% | - | - | - |
| 30.11.1995 | 113.10 | 106.80 | 6.30 | 5.90% | - | - | - |
| 31.10.1995 | 106.80 | 92.70 | 14.10 | 15.21% | - | - | - |
| 30.09.1995 | 92.70 | 93.20 | -0.50 | -0.54% | - | - | - |
| 31.08.1995 | 93.20 | 100.10 | -6.90 | -6.89% | - | - | - |
| 31.07.1995 | 100.10 | 121.00 | -20.90 | -17.27% | - | - | - |
| 30.06.1995 | 121.00 | 137.90 | -16.90 | -12.26% | - | - | - |
| 31.05.1995 | 137.90 | 140.20 | -2.30 | -1.64% | - | - | - |
| 30.04.1995 | 140.20 | 147.00 | -6.80 | -4.63% | - | - | - |
| 31.03.1995 | 147.00 | 113.30 | 33.70 | 29.74% | - | - | - |
| 28.02.1995 | 113.30 | 105.40 | 7.90 | 7.50% | - | - | - |
| 31.01.1995 | 105.40 | - | - | - | - | - | - |
Graf jako obrázek

Podobné sestavy
Aplikace Ekonomika ČNB ze sekce makroekonomika zobrazuje časové řady hlavních makroekonomických údajů z ekonomiky ČR. Najdete zde přes 10.000 grafů různých hodnot od úrokových sazeb, přes statistiky státního rozpočtu, statistiky ČNB a data zpracovávaná ČSÚ. Data jsou k dispozici obvykle za posledních více než 20 let, od prosince roku 1992. Zdroj dat: ČNB ARAD

