Trade credits and advances (AF.81) (Liabilities, stocks, Households) - ekonomika ČNB
Aktualizace dat Trade credits and advances (AF.81) (Liabilities, stocks, Households) v této aplikaci skončila 30.6.2023. Aktualizovná data časových řad najdete na stránkách nové aplikace z dat ARAD ČNB
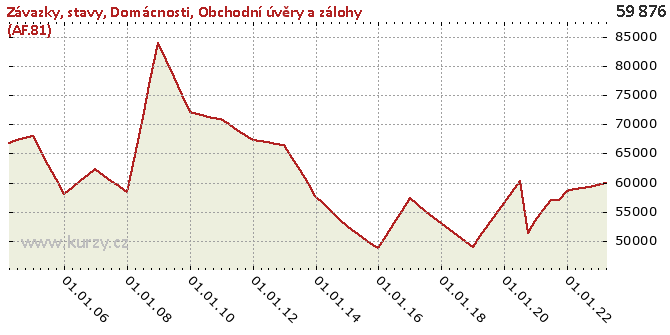
Graf hodnot, Liabilities, stocks, Households
Meziroční srovnání
Minima a maxima
| Typ | Období | Hodnota |
|---|---|---|
| Min | 31.12.2015 | 48 704.00 |
| Max | 31.12.2008 | 84 007.00 |
Historické hodnoty
| Období | Hodnota | Předchozí | Rozdíl | Změna | Před rokem | Rozdíl | Změna |
|---|---|---|---|---|---|---|---|
| 31.03.2020 | 58 395.00 | 56 536.00 | 1 859.00 | 3.29% | 50 894.00 | 7 501.00 | 14.74% |
| 31.12.2019 | 56 536.00 | 54 673.00 | 1 863.00 | 3.41% | 49 014.00 | 7 522.00 | 15.35% |
| 30.09.2019 | 54 673.00 | 52 784.00 | 1 889.00 | 3.58% | 50 034.00 | 4 639.00 | 9.27% |
| 30.06.2019 | 52 784.00 | 50 894.00 | 1 890.00 | 3.71% | 51 060.00 | 1 724.00 | 3.38% |
| 31.03.2019 | 50 894.00 | 49 014.00 | 1 880.00 | 3.84% | 52 082.00 | -1 188.00 | -2.28% |
| 31.12.2018 | 49 014.00 | 50 034.00 | -1 020.00 | -2.04% | 53 105.00 | -4 091.00 | -7.70% |
| 30.09.2018 | 50 034.00 | 51 060.00 | -1 026.00 | -2.01% | 54 151.00 | -4 117.00 | -7.60% |
| 30.06.2018 | 51 060.00 | 52 082.00 | -1 022.00 | -1.96% | 55 203.00 | -4 143.00 | -7.50% |
| 31.03.2018 | 52 082.00 | 53 105.00 | -1 023.00 | -1.93% | 56 262.00 | -4 180.00 | -7.43% |
| 31.12.2017 | 53 105.00 | 54 151.00 | -1 046.00 | -1.93% | 57 315.00 | -4 210.00 | -7.35% |
| 30.09.2017 | 54 151.00 | 55 203.00 | -1 052.00 | -1.91% | 55 172.00 | -1 021.00 | -1.85% |
| 30.06.2017 | 55 203.00 | 56 262.00 | -1 059.00 | -1.88% | 53 015.00 | 2 188.00 | 4.13% |
| 31.03.2017 | 56 262.00 | 57 315.00 | -1 053.00 | -1.84% | 50 857.00 | 5 405.00 | 10.63% |
| 31.12.2016 | 57 315.00 | 55 172.00 | 2 143.00 | 3.88% | 48 704.00 | 8 611.00 | 17.68% |
| 30.09.2016 | 55 172.00 | 53 015.00 | 2 157.00 | 4.07% | 49 651.00 | 5 521.00 | 11.12% |
| 30.06.2016 | 53 015.00 | 50 857.00 | 2 158.00 | 4.24% | 50 597.00 | 2 418.00 | 4.78% |
| 31.03.2016 | 50 857.00 | 48 704.00 | 2 153.00 | 4.42% | 51 546.00 | - 689.00 | -1.34% |
| 31.12.2015 | 48 704.00 | 49 651.00 | - 947.00 | -1.91% | 52 493.00 | -3 789.00 | -7.22% |
| 30.09.2015 | 49 651.00 | 50 597.00 | - 946.00 | -1.87% | 53 815.00 | -4 164.00 | -7.74% |
| 30.06.2015 | 50 597.00 | 51 546.00 | - 949.00 | -1.84% | 55 134.00 | -4 537.00 | -8.23% |
| 31.03.2015 | 51 546.00 | 52 493.00 | - 947.00 | -1.80% | 56 457.00 | -4 911.00 | -8.70% |
| 31.12.2014 | 52 493.00 | 53 815.00 | -1 322.00 | -2.46% | 57 778.00 | -5 285.00 | -9.15% |
| 30.09.2014 | 53 815.00 | 55 134.00 | -1 319.00 | -2.39% | 59 930.00 | -6 115.00 | -10.20% |
| 30.06.2014 | 55 134.00 | 56 457.00 | -1 323.00 | -2.34% | 62 089.00 | -6 955.00 | -11.20% |
| 31.03.2014 | 56 457.00 | 57 778.00 | -1 321.00 | -2.29% | 64 248.00 | -7 791.00 | -12.13% |
| 31.12.2013 | 57 778.00 | 59 930.00 | -2 152.00 | -3.59% | 66 405.00 | -8 627.00 | -12.99% |
| 30.09.2013 | 59 930.00 | 62 089.00 | -2 159.00 | -3.48% | 66 643.00 | -6 713.00 | -10.07% |
| 30.06.2013 | 62 089.00 | 64 248.00 | -2 159.00 | -3.36% | 66 884.00 | -4 795.00 | -7.17% |
| 31.03.2013 | 64 248.00 | 66 405.00 | -2 157.00 | -3.25% | 67 126.00 | -2 878.00 | -4.29% |
| 31.12.2012 | 66 405.00 | 66 643.00 | - 238.00 | -0.36% | 67 367.00 | - 962.00 | -1.43% |
| 30.09.2012 | 66 643.00 | 66 884.00 | - 241.00 | -0.36% | 68 230.00 | -1 587.00 | -2.33% |
| 30.06.2012 | 66 884.00 | 67 126.00 | - 242.00 | -0.36% | 69 095.00 | -2 211.00 | -3.20% |
| 31.03.2012 | 67 126.00 | 67 367.00 | - 241.00 | -0.36% | 69 966.00 | -2 840.00 | -4.06% |
| 31.12.2011 | 67 367.00 | 68 230.00 | - 863.00 | -1.26% | 70 832.00 | -3 465.00 | -4.89% |
| 30.09.2011 | 68 230.00 | 69 095.00 | - 865.00 | -1.25% | 71 145.00 | -2 915.00 | -4.10% |
| 30.06.2011 | 69 095.00 | 69 966.00 | - 871.00 | -1.24% | 71 466.00 | -2 371.00 | -3.32% |
| 31.03.2011 | 69 966.00 | 70 832.00 | - 866.00 | -1.22% | 71 785.00 | -1 819.00 | -2.53% |
| 31.12.2010 | 70 832.00 | 71 145.00 | - 313.00 | -0.44% | 72 102.00 | -1 270.00 | -1.76% |
| 30.09.2010 | 71 145.00 | 71 466.00 | - 321.00 | -0.45% | 75 060.00 | -3 915.00 | -5.22% |
| 30.06.2010 | 71 466.00 | 71 785.00 | - 319.00 | -0.44% | 78 049.00 | -6 583.00 | -8.43% |
| 31.03.2010 | 71 785.00 | 72 102.00 | - 317.00 | -0.44% | 81 031.00 | -9 246.00 | -11.41% |
| 31.12.2009 | 72 102.00 | 75 060.00 | -2 958.00 | -3.94% | 84 007.00 | -11 905.00 | -14.17% |
| 30.09.2009 | 75 060.00 | 78 049.00 | -2 989.00 | -3.83% | 77 618.00 | -2 558.00 | -3.30% |
| 30.06.2009 | 78 049.00 | 81 031.00 | -2 982.00 | -3.68% | 71 209.00 | 6 840.00 | 9.61% |
| 31.03.2009 | 81 031.00 | 84 007.00 | -2 976.00 | -3.54% | 64 798.00 | 16 233.00 | 25.05% |
| 31.12.2008 | 84 007.00 | 77 618.00 | 6 389.00 | 8.23% | 58 395.00 | 25 612.00 | 43.86% |
| 30.09.2008 | 77 618.00 | 71 209.00 | 6 409.00 | 9.00% | 59 361.00 | 18 257.00 | 30.76% |
| 30.06.2008 | 71 209.00 | 64 798.00 | 6 411.00 | 9.89% | 60 329.00 | 10 880.00 | 18.03% |
| 31.03.2008 | 64 798.00 | 58 395.00 | 6 403.00 | 10.96% | 61 301.00 | 3 497.00 | 5.70% |
| 31.12.2007 | 58 395.00 | 59 361.00 | - 966.00 | -1.63% | 62 269.00 | -3 874.00 | -6.22% |
| 30.09.2007 | 59 361.00 | 60 329.00 | - 968.00 | -1.60% | 61 233.00 | -1 872.00 | -3.06% |
| 30.06.2007 | 60 329.00 | 61 301.00 | - 972.00 | -1.59% | 60 186.00 | 143.00 | 0.24% |
| 31.03.2007 | 61 301.00 | 62 269.00 | - 968.00 | -1.55% | 59 137.00 | 2 164.00 | 3.66% |
| 31.12.2006 | 62 269.00 | 61 233.00 | 1 036.00 | 1.69% | 58 093.00 | 4 176.00 | 7.19% |
| 30.09.2006 | 61 233.00 | 60 186.00 | 1 047.00 | 1.74% | 60 564.00 | 669.00 | 1.10% |
| 30.06.2006 | 60 186.00 | 59 137.00 | 1 049.00 | 1.77% | 63 039.00 | -2 853.00 | -4.53% |
| 31.03.2006 | 59 137.00 | 58 093.00 | 1 044.00 | 1.80% | 65 511.00 | -6 374.00 | -9.73% |
| 31.12.2005 | 58 093.00 | 60 564.00 | -2 471.00 | -4.08% | 67 984.00 | -9 891.00 | -14.55% |
| 30.09.2005 | 60 564.00 | 63 039.00 | -2 475.00 | -3.93% | 67 609.00 | -7 045.00 | -10.42% |
| 30.06.2005 | 63 039.00 | 65 511.00 | -2 472.00 | -3.77% | 67 234.00 | -4 195.00 | -6.24% |
| 31.03.2005 | 65 511.00 | 67 984.00 | -2 473.00 | -3.64% | 66 863.00 | -1 352.00 | -2.02% |
| 31.12.2004 | 67 984.00 | 67 609.00 | 375.00 | 0.55% | - | - | - |
| 30.09.2004 | 67 609.00 | 67 234.00 | 375.00 | 0.56% | - | - | - |
| 30.06.2004 | 67 234.00 | 66 863.00 | 371.00 | 0.55% | - | - | - |
| 31.03.2004 | 66 863.00 | - | - | - | - | - | - |
Graf jako obrázek

Podobné sestavy
Aplikace Ekonomika ČNB ze sekce makroekonomika zobrazuje časové řady hlavních makroekonomických údajů z ekonomiky ČR. Najdete zde přes 10.000 grafů různých hodnot od úrokových sazeb, přes statistiky státního rozpočtu, statistiky ČNB a data zpracovávaná ČSÚ. Data jsou k dispozici obvykle za posledních více než 20 let, od prosince roku 1992. Zdroj dat: ČNB ARAD

