Mutual funds shares/units issued (Equity Funds Balance Sheet) - ekonomika ČNB
Aktualizace dat Mutual funds shares/units issued (Equity Funds Balance Sheet) v této aplikaci skončila 30.6.2023. Aktualizovná data časových řad najdete na stránkách nové aplikace z dat ARAD ČNB
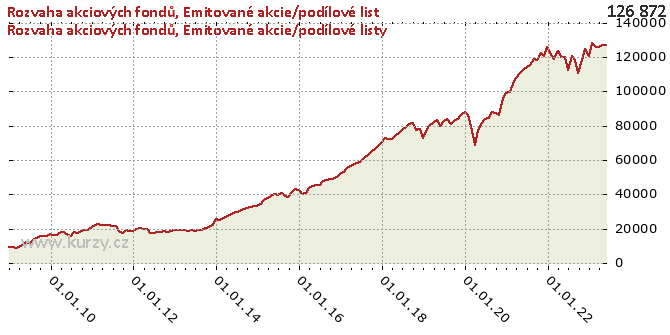
Graf hodnot, Equity Funds Balance Sheet
Meziroční srovnání
Minima a maxima
| Typ | Období | Hodnota |
|---|---|---|
| Max | 31.12.2019 | 87 721.50 |
| Min | 28.02.2009 | 8 431.44 |
Historické hodnoty
| Období | Hodnota | Předchozí | Rozdíl | Změna | Před rokem | Rozdíl | Změna |
|---|---|---|---|---|---|---|---|
| 30.06.2020 | 83 581.15 | 81 497.45 | 2 083.70 | 2.56% | 82 819.98 | 761.17 | 0.92% |
| 31.05.2020 | 81 497.45 | 77 143.12 | 4 354.33 | 5.64% | 79 588.52 | 1 908.93 | 2.40% |
| 30.04.2020 | 77 143.12 | 69 069.76 | 8 073.36 | 11.69% | 83 309.77 | -6 166.65 | -7.40% |
| 31.03.2020 | 69 069.76 | 80 053.21 | -10 983.44 | -13.72% | 81 780.07 | -12 710.30 | -15.54% |
| 29.02.2020 | 80 053.21 | 86 159.04 | -6 105.84 | -7.09% | 80 292.97 | - 239.76 | -0.30% |
| 31.01.2020 | 86 159.04 | 87 721.50 | -1 562.46 | -1.78% | 78 326.29 | 7 832.75 | 10.00% |
| 31.12.2019 | 87 721.50 | 86 200.66 | 1 520.84 | 1.76% | 72 896.61 | 14 824.89 | 20.34% |
| 30.11.2019 | 86 200.66 | 83 930.08 | 2 270.58 | 2.71% | 78 292.07 | 7 908.59 | 10.10% |
| 31.10.2019 | 83 930.08 | 82 715.11 | 1 214.97 | 1.47% | 77 716.93 | 6 213.15 | 7.99% |
| 30.09.2019 | 82 715.11 | 81 215.42 | 1 499.69 | 1.85% | 81 791.52 | 923.59 | 1.13% |
| 31.08.2019 | 81 215.42 | 83 640.71 | -2 425.30 | -2.90% | 80 753.04 | 462.38 | 0.57% |
| 31.07.2019 | 83 640.71 | 82 819.98 | 820.74 | 0.99% | 79 170.21 | 4 470.50 | 5.65% |
| 30.06.2019 | 82 819.98 | 79 588.52 | 3 231.46 | 4.06% | 77 233.74 | 5 586.24 | 7.23% |
| 31.05.2019 | 79 588.52 | 83 309.77 | -3 721.25 | -4.47% | 75 777.70 | 3 810.82 | 5.03% |
| 30.04.2019 | 83 309.77 | 81 780.07 | 1 529.71 | 1.87% | 74 203.74 | 9 106.03 | 12.27% |
| 31.03.2019 | 81 780.07 | 80 292.97 | 1 487.10 | 1.85% | 72 479.25 | 9 300.82 | 12.83% |
| 28.02.2019 | 80 292.97 | 78 326.29 | 1 966.67 | 2.51% | 72 441.59 | 7 851.37 | 10.84% |
| 31.01.2019 | 78 326.29 | 72 896.61 | 5 429.68 | 7.45% | 72 800.60 | 5 525.69 | 7.59% |
| 31.12.2018 | 72 896.61 | 78 292.07 | -5 395.46 | -6.89% | 70 563.93 | 2 332.68 | 3.31% |
| 30.11.2018 | 78 292.07 | 77 716.93 | 575.14 | 0.74% | 68 144.03 | 10 148.04 | 14.89% |
| 31.10.2018 | 77 716.93 | 81 791.52 | -4 074.59 | -4.98% | 66 465.19 | 11 251.74 | 16.93% |
| 30.09.2018 | 81 791.52 | 80 753.04 | 1 038.48 | 1.29% | 64 539.02 | 17 252.50 | 26.73% |
| 31.08.2018 | 80 753.04 | 79 170.21 | 1 582.83 | 2.00% | 62 650.23 | 18 102.81 | 28.89% |
| 31.07.2018 | 79 170.21 | 77 233.74 | 1 936.47 | 2.51% | 61 066.16 | 18 104.05 | 29.65% |
| 30.06.2018 | 77 233.74 | 75 777.70 | 1 456.05 | 1.92% | 59 489.16 | 17 744.58 | 29.83% |
| 31.05.2018 | 75 777.70 | 74 203.74 | 1 573.95 | 2.12% | 58 473.68 | 17 304.01 | 29.59% |
| 30.04.2018 | 74 203.74 | 72 479.25 | 1 724.50 | 2.38% | 57 649.52 | 16 554.22 | 28.72% |
| 31.03.2018 | 72 479.25 | 72 441.59 | 37.65 | 0.05% | 56 399.56 | 16 079.69 | 28.51% |
| 28.02.2018 | 72 441.59 | 72 800.60 | - 359.00 | -0.49% | 55 066.86 | 17 374.73 | 31.55% |
| 31.01.2018 | 72 800.60 | 70 563.93 | 2 236.67 | 3.17% | 53 046.18 | 19 754.42 | 37.24% |
| 31.12.2017 | 70 563.93 | 68 144.03 | 2 419.90 | 3.55% | 52 063.75 | 18 500.18 | 35.53% |
| 30.11.2017 | 68 144.03 | 66 465.19 | 1 678.84 | 2.53% | 50 277.20 | 17 866.83 | 35.54% |
| 31.10.2017 | 66 465.19 | 64 539.02 | 1 926.17 | 2.98% | 48 817.86 | 17 647.32 | 36.15% |
| 30.09.2017 | 64 539.02 | 62 650.23 | 1 888.79 | 3.01% | 48 945.79 | 15 593.23 | 31.86% |
| 31.08.2017 | 62 650.23 | 61 066.16 | 1 584.07 | 2.59% | 48 044.96 | 14 605.27 | 30.40% |
| 31.07.2017 | 61 066.16 | 59 489.16 | 1 577.00 | 2.65% | 47 586.29 | 13 479.87 | 28.33% |
| 30.06.2017 | 59 489.16 | 58 473.68 | 1 015.48 | 1.74% | 45 170.91 | 14 318.25 | 31.70% |
| 31.05.2017 | 58 473.68 | 57 649.52 | 824.16 | 1.43% | 45 595.51 | 12 878.17 | 28.24% |
| 30.04.2017 | 57 649.52 | 56 399.56 | 1 249.96 | 2.22% | 44 570.89 | 13 078.63 | 29.34% |
| 31.03.2017 | 56 399.56 | 55 066.86 | 1 332.69 | 2.42% | 43 450.07 | 12 949.49 | 29.80% |
| 28.02.2017 | 55 066.86 | 53 046.18 | 2 020.68 | 3.81% | 40 943.92 | 14 122.95 | 34.49% |
| 31.01.2017 | 53 046.18 | 52 063.75 | 982.44 | 1.89% | 40 403.25 | 12 642.94 | 31.29% |
| 31.12.2016 | 52 063.75 | 50 277.20 | 1 786.55 | 3.55% | 42 380.39 | 9 683.36 | 22.85% |
| 30.11.2016 | 50 277.20 | 48 817.86 | 1 459.34 | 2.99% | 42 813.36 | 7 463.84 | 17.43% |
| 31.10.2016 | 48 817.86 | 48 945.79 | - 127.93 | -0.26% | 41 486.53 | 7 331.33 | 17.67% |
| 30.09.2016 | 48 945.79 | 48 044.96 | 900.83 | 1.87% | 38 479.93 | 10 465.86 | 27.20% |
| 31.08.2016 | 48 044.96 | 47 586.29 | 458.67 | 0.96% | 39 024.53 | 9 020.43 | 23.11% |
| 31.07.2016 | 47 586.29 | 45 170.91 | 2 415.39 | 5.35% | 41 009.87 | 6 576.43 | 16.04% |
| 30.06.2016 | 45 170.91 | 45 595.51 | - 424.60 | -0.93% | 39 757.12 | 5 413.79 | 13.62% |
| 31.05.2016 | 45 595.51 | 44 570.89 | 1 024.62 | 2.30% | 40 351.03 | 5 244.48 | 13.00% |
| 30.04.2016 | 44 570.89 | 43 450.07 | 1 120.82 | 2.58% | 39 047.08 | 5 523.81 | 14.15% |
| 31.03.2016 | 43 450.07 | 40 943.92 | 2 506.15 | 6.12% | 38 002.88 | 5 447.19 | 14.33% |
| 29.02.2016 | 40 943.92 | 40 403.25 | 540.67 | 1.34% | 36 396.37 | 4 547.55 | 12.49% |
| 31.01.2016 | 40 403.25 | 42 380.39 | -1 977.14 | -4.67% | 34 070.90 | 6 332.34 | 18.59% |
| 31.12.2015 | 42 380.39 | 42 813.36 | - 432.97 | -1.01% | 33 037.23 | 9 343.16 | 28.28% |
| 30.11.2015 | 42 813.36 | 41 486.53 | 1 326.83 | 3.20% | 33 270.84 | 9 542.52 | 28.68% |
| 31.10.2015 | 41 486.53 | 38 479.93 | 3 006.60 | 7.81% | 32 320.18 | 9 166.35 | 28.36% |
| 30.09.2015 | 38 479.93 | 39 024.53 | - 544.60 | -1.40% | 31 780.14 | 6 699.79 | 21.08% |
| 31.08.2015 | 39 024.53 | 41 009.87 | -1 985.34 | -4.84% | 31 576.58 | 7 447.95 | 23.59% |
| 31.07.2015 | 41 009.87 | 39 757.12 | 1 252.75 | 3.15% | 30 249.53 | 10 760.34 | 35.57% |
| 30.06.2015 | 39 757.12 | 40 351.03 | - 593.91 | -1.47% | 29 755.89 | 10 001.23 | 33.61% |
| 31.05.2015 | 40 351.03 | 39 047.08 | 1 303.95 | 3.34% | 28 965.24 | 11 385.79 | 39.31% |
| 30.04.2015 | 39 047.08 | 38 002.88 | 1 044.20 | 2.75% | 27 668.85 | 11 378.23 | 41.12% |
| 31.03.2015 | 38 002.88 | 36 396.37 | 1 606.51 | 4.41% | 26 663.65 | 11 339.23 | 42.53% |
| 28.02.2015 | 36 396.37 | 34 070.90 | 2 325.47 | 6.83% | 26 286.37 | 10 110.00 | 38.46% |
| 31.01.2015 | 34 070.90 | 33 037.23 | 1 033.67 | 3.13% | 25 204.07 | 8 866.83 | 35.18% |
| 31.12.2014 | 33 037.23 | 33 270.84 | - 233.61 | -0.70% | 25 443.50 | 7 593.73 | 29.85% |
| 30.11.2014 | 33 270.84 | 32 320.18 | 950.66 | 2.94% | 21 806.19 | 11 464.65 | 52.58% |
| 31.10.2014 | 32 320.18 | 31 780.14 | 540.04 | 1.70% | 21 011.00 | 11 309.18 | 53.83% |
| 30.09.2014 | 31 780.14 | 31 576.58 | 203.56 | 0.64% | 20 256.14 | 11 524.00 | 56.89% |
| 31.08.2014 | 31 576.58 | 30 249.53 | 1 327.05 | 4.39% | 19 191.42 | 12 385.16 | 64.53% |
| 31.07.2014 | 30 249.53 | 29 755.89 | 493.64 | 1.66% | 19 264.33 | 10 985.20 | 57.02% |
| 30.06.2014 | 29 755.89 | 28 965.24 | 790.65 | 2.73% | 18 364.62 | 11 391.27 | 62.03% |
| 31.05.2014 | 28 965.24 | 27 668.85 | 1 296.39 | 4.69% | 19 065.64 | 9 899.59 | 51.92% |
| 30.04.2014 | 27 668.85 | 26 663.65 | 1 005.20 | 3.77% | 18 791.08 | 8 877.77 | 47.24% |
| 31.03.2014 | 26 663.65 | 26 286.37 | 377.28 | 1.44% | 19 142.78 | 7 520.87 | 39.29% |
| 28.02.2014 | 26 286.37 | 25 204.07 | 1 082.30 | 4.29% | 19 042.03 | 7 244.34 | 38.04% |
| 31.01.2014 | 25 204.07 | 25 443.50 | - 239.43 | -0.94% | 19 019.28 | 6 184.79 | 32.52% |
| 31.12.2013 | 25 443.50 | 21 806.19 | 3 637.32 | 16.68% | 19 169.47 | 6 274.04 | 32.73% |
| 30.11.2013 | 21 806.19 | 21 011.00 | 795.18 | 3.78% | 18 314.81 | 3 491.38 | 19.06% |
| 31.10.2013 | 21 011.00 | 20 256.14 | 754.87 | 3.73% | 18 281.48 | 2 729.52 | 14.93% |
| 30.09.2013 | 20 256.14 | 19 191.42 | 1 064.71 | 5.55% | 18 633.91 | 1 622.22 | 8.71% |
| 31.08.2013 | 19 191.42 | 19 264.33 | -72.90 | -0.38% | 18 265.21 | 926.21 | 5.07% |
| 31.07.2013 | 19 264.33 | 18 364.62 | 899.71 | 4.90% | 18 050.23 | 1 214.10 | 6.73% |
| 30.06.2013 | 18 364.62 | 19 065.64 | - 701.03 | -3.68% | 17 709.04 | 655.58 | 3.70% |
| 31.05.2013 | 19 065.64 | 18 791.08 | 274.57 | 1.46% | 17 493.24 | 1 572.40 | 8.99% |
| 30.04.2013 | 18 791.08 | 19 142.78 | - 351.70 | -1.84% | 19 693.95 | - 902.87 | -4.58% |
| 31.03.2013 | 19 142.78 | 19 042.03 | 100.74 | 0.53% | 19 816.67 | - 673.89 | -3.40% |
| 28.02.2013 | 19 042.03 | 19 019.28 | 22.76 | 0.12% | 20 447.49 | -1 405.46 | -6.87% |
| 31.01.2013 | 19 019.28 | 19 169.47 | - 150.19 | -0.78% | 19 822.35 | - 803.08 | -4.05% |
| 31.12.2012 | 19 169.47 | 18 314.81 | 854.65 | 4.67% | 18 347.44 | 822.03 | 4.48% |
| 30.11.2012 | 18 314.81 | 18 281.48 | 33.33 | 0.18% | 18 445.14 | - 130.33 | -0.71% |
| 31.10.2012 | 18 281.48 | 18 633.91 | - 352.43 | -1.89% | 18 991.43 | - 709.94 | -3.74% |
| 30.09.2012 | 18 633.91 | 18 265.21 | 368.70 | 2.02% | 17 194.04 | 1 439.88 | 8.37% |
| 31.08.2012 | 18 265.21 | 18 050.23 | 214.98 | 1.19% | 18 732.45 | - 467.24 | -2.49% |
| 31.07.2012 | 18 050.23 | 17 709.04 | 341.19 | 1.93% | 21 348.19 | -3 297.95 | -15.45% |
| 30.06.2012 | 17 709.04 | 17 493.24 | 215.79 | 1.23% | 21 515.89 | -3 806.86 | -17.69% |
| 31.05.2012 | 17 493.24 | 19 693.95 | -2 200.70 | -11.17% | 22 048.19 | -4 554.95 | -20.66% |
| 30.04.2012 | 19 693.95 | 19 816.67 | - 122.72 | -0.62% | 22 355.93 | -2 661.98 | -11.91% |
| 31.03.2012 | 19 816.67 | 20 447.49 | - 630.82 | -3.08% | 22 174.56 | -2 357.89 | -10.63% |
| 29.02.2012 | 20 447.49 | 19 822.35 | 625.14 | 3.15% | 22 494.10 | -2 046.61 | -9.10% |
| 31.01.2012 | 19 822.35 | 18 347.44 | 1 474.91 | 8.04% | 21 950.32 | -2 127.96 | -9.69% |
| 31.12.2011 | 18 347.44 | 18 445.14 | -97.70 | -0.53% | 20 888.81 | -2 541.37 | -12.17% |
| 30.11.2011 | 18 445.14 | 18 991.43 | - 546.29 | -2.88% | 19 431.98 | - 986.84 | -5.08% |
| 31.10.2011 | 18 991.43 | 17 194.04 | 1 797.39 | 10.45% | 18 975.49 | 15.94 | 0.08% |
| 30.09.2011 | 17 194.04 | 18 732.45 | -1 538.41 | -8.21% | 18 339.62 | -1 145.59 | -6.25% |
| 31.08.2011 | 18 732.45 | 21 348.19 | -2 615.73 | -12.25% | 17 506.81 | 1 225.64 | 7.00% |
| 31.07.2011 | 21 348.19 | 21 515.89 | - 167.71 | -0.78% | 17 868.10 | 3 480.09 | 19.48% |
| 30.06.2011 | 21 515.89 | 22 048.19 | - 532.30 | -2.41% | 15 701.28 | 5 814.61 | 37.03% |
| 31.05.2011 | 22 048.19 | 22 355.93 | - 307.74 | -1.38% | 16 241.98 | 5 806.21 | 35.75% |
| 30.04.2011 | 22 355.93 | 22 174.56 | 181.37 | 0.82% | 17 856.44 | 4 499.49 | 25.20% |
| 31.03.2011 | 22 174.56 | 22 494.10 | - 319.54 | -1.42% | 17 762.47 | 4 412.09 | 24.84% |
| 28.02.2011 | 22 494.10 | 21 950.32 | 543.78 | 2.48% | 16 480.18 | 6 013.92 | 36.49% |
| 31.01.2011 | 21 950.32 | 20 888.81 | 1 061.51 | 5.08% | 16 544.02 | 5 406.30 | 32.68% |
| 31.12.2010 | 20 888.81 | 19 431.98 | 1 456.83 | 7.50% | 16 703.25 | 4 185.56 | 25.06% |
| 30.11.2010 | 19 431.98 | 18 975.49 | 456.50 | 2.41% | 15 930.52 | 3 501.46 | 21.98% |
| 31.10.2010 | 18 975.49 | 18 339.62 | 635.87 | 3.47% | 15 798.64 | 3 176.85 | 20.11% |
| 30.09.2010 | 18 339.62 | 17 506.81 | 832.82 | 4.76% | 15 528.06 | 2 811.56 | 18.11% |
| 31.08.2010 | 17 506.81 | 17 868.10 | - 361.29 | -2.02% | 14 713.78 | 2 793.03 | 18.98% |
| 31.07.2010 | 17 868.10 | 15 701.28 | 2 166.82 | 13.80% | 13 195.24 | 4 672.86 | 35.41% |
| 30.06.2010 | 15 701.28 | 16 241.98 | - 540.70 | -3.33% | 11 878.01 | 3 823.27 | 32.19% |
| 31.05.2010 | 16 241.98 | 17 856.44 | -1 614.46 | -9.04% | 11 976.51 | 4 265.47 | 35.62% |
| 30.04.2010 | 17 856.44 | 17 762.47 | 93.96 | 0.53% | 10 665.58 | 7 190.86 | 67.42% |
| 31.03.2010 | 17 762.47 | 16 480.18 | 1 282.29 | 7.78% | 9 195.01 | 8 567.47 | 93.18% |
| 28.02.2010 | 16 480.18 | 16 544.02 | -63.84 | -0.39% | 8 431.44 | 8 048.74 | 95.46% |
| 31.01.2010 | 16 544.02 | 16 703.25 | - 159.23 | -0.95% | 9 161.79 | 7 382.23 | 80.58% |
| 31.12.2009 | 16 703.25 | 15 930.52 | 772.72 | 4.85% | 9 368.47 | 7 334.78 | 78.29% |
| 30.11.2009 | 15 930.52 | 15 798.64 | 131.88 | 0.83% | - | - | - |
| 31.10.2009 | 15 798.64 | 15 528.06 | 270.58 | 1.74% | - | - | - |
| 30.09.2009 | 15 528.06 | 14 713.78 | 814.28 | 5.53% | - | - | - |
| 31.08.2009 | 14 713.78 | 13 195.24 | 1 518.54 | 11.51% | - | - | - |
| 31.07.2009 | 13 195.24 | 11 878.01 | 1 317.22 | 11.09% | - | - | - |
| 30.06.2009 | 11 878.01 | 11 976.51 | -98.50 | -0.82% | - | - | - |
| 31.05.2009 | 11 976.51 | 10 665.58 | 1 310.93 | 12.29% | - | - | - |
| 30.04.2009 | 10 665.58 | 9 195.01 | 1 470.57 | 15.99% | - | - | - |
| 31.03.2009 | 9 195.01 | 8 431.44 | 763.56 | 9.06% | - | - | - |
| 28.02.2009 | 8 431.44 | 9 161.79 | - 730.35 | -7.97% | - | - | - |
| 31.01.2009 | 9 161.79 | 9 368.47 | - 206.67 | -2.21% | - | - | - |
| 31.12.2008 | 9 368.47 | - | - | - | - | - | - |
Graf jako obrázek

Podobné sestavy
Aplikace Ekonomika ČNB ze sekce makroekonomika zobrazuje časové řady hlavních makroekonomických údajů z ekonomiky ČR. Najdete zde přes 10.000 grafů různých hodnot od úrokových sazeb, přes statistiky státního rozpočtu, statistiky ČNB a data zpracovávaná ČSÚ. Data jsou k dispozici obvykle za posledních více než 20 let, od prosince roku 1992. Zdroj dat: ČNB ARAD

