Mutual funds shares/units issued (Bond Funds Balance Sheet) - ekonomika ČNB
Aktualizace dat Mutual funds shares/units issued (Bond Funds Balance Sheet) v této aplikaci skončila 30.6.2023. Aktualizovná data časových řad najdete na stránkách nové aplikace z dat ARAD ČNB
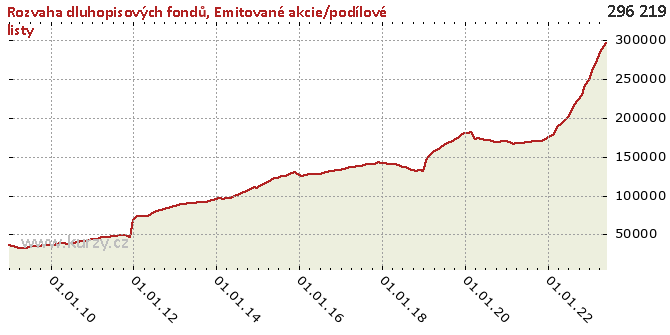
Graf hodnot, Bond Funds Balance Sheet
Meziroční srovnání
Minima a maxima
| Typ | Období | Hodnota |
|---|---|---|
| Max | 29.02.2020 | 181 783.25 |
| Min | 31.05.2009 | 32 125.80 |
Historické hodnoty
| Období | Hodnota | Předchozí | Rozdíl | Změna | Před rokem | Rozdíl | Změna |
|---|---|---|---|---|---|---|---|
| 30.06.2020 | 171 343.42 | 172 772.49 | -1 429.08 | -0.83% | 164 540.98 | 6 802.44 | 4.13% |
| 31.05.2020 | 172 772.49 | 173 179.08 | - 406.58 | -0.23% | 160 673.02 | 12 099.48 | 7.53% |
| 30.04.2020 | 173 179.08 | 172 479.63 | 699.44 | 0.41% | 158 108.31 | 15 070.76 | 9.53% |
| 31.03.2020 | 172 479.63 | 181 783.25 | -9 303.62 | -5.12% | 155 484.10 | 16 995.54 | 10.93% |
| 29.02.2020 | 181 783.25 | 180 198.32 | 1 584.93 | 0.88% | 151 433.96 | 30 349.29 | 20.04% |
| 31.01.2020 | 180 198.32 | 179 710.27 | 488.05 | 0.27% | 148 543.79 | 31 654.52 | 21.31% |
| 31.12.2019 | 179 710.27 | 177 327.43 | 2 382.83 | 1.34% | 131 215.57 | 48 494.69 | 36.96% |
| 30.11.2019 | 177 327.43 | 174 324.75 | 3 002.69 | 1.72% | 132 324.22 | 45 003.21 | 34.01% |
| 31.10.2019 | 174 324.75 | 171 277.79 | 3 046.96 | 1.78% | 131 193.38 | 43 131.36 | 32.88% |
| 30.09.2019 | 171 277.79 | 168 627.03 | 2 650.76 | 1.57% | 132 386.99 | 38 890.80 | 29.38% |
| 31.08.2019 | 168 627.03 | 167 678.92 | 948.10 | 0.57% | 134 583.73 | 34 043.29 | 25.30% |
| 31.07.2019 | 167 678.92 | 164 540.98 | 3 137.94 | 1.91% | 136 988.44 | 30 690.49 | 22.40% |
| 30.06.2019 | 164 540.98 | 160 673.02 | 3 867.97 | 2.41% | 136 795.57 | 27 745.42 | 20.28% |
| 31.05.2019 | 160 673.02 | 158 108.31 | 2 564.70 | 1.62% | 138 794.76 | 21 878.26 | 15.76% |
| 30.04.2019 | 158 108.31 | 155 484.10 | 2 624.22 | 1.69% | 139 887.58 | 18 220.73 | 13.03% |
| 31.03.2019 | 155 484.10 | 151 433.96 | 4 050.14 | 2.67% | 140 702.01 | 14 782.08 | 10.51% |
| 28.02.2019 | 151 433.96 | 148 543.79 | 2 890.17 | 1.95% | 140 866.49 | 10 567.47 | 7.50% |
| 31.01.2019 | 148 543.79 | 131 215.57 | 17 328.22 | 13.21% | 141 660.74 | 6 883.06 | 4.86% |
| 31.12.2018 | 131 215.57 | 132 324.22 | -1 108.65 | -0.84% | 141 830.67 | -10 615.09 | -7.48% |
| 30.11.2018 | 132 324.22 | 131 193.38 | 1 130.84 | 0.86% | 142 560.72 | -10 236.50 | -7.18% |
| 31.10.2018 | 131 193.38 | 132 386.99 | -1 193.60 | -0.90% | 140 782.06 | -9 588.68 | -6.81% |
| 30.09.2018 | 132 386.99 | 134 583.73 | -2 196.75 | -1.63% | 139 899.04 | -7 512.06 | -5.37% |
| 31.08.2018 | 134 583.73 | 136 988.44 | -2 404.70 | -1.76% | 139 948.33 | -5 364.59 | -3.83% |
| 31.07.2018 | 136 988.44 | 136 795.57 | 192.87 | 0.14% | 139 236.03 | -2 247.59 | -1.61% |
| 30.06.2018 | 136 795.57 | 138 794.76 | -1 999.19 | -1.44% | 138 285.39 | -1 489.83 | -1.08% |
| 31.05.2018 | 138 794.76 | 139 887.58 | -1 092.83 | -0.78% | 138 138.00 | 656.76 | 0.48% |
| 30.04.2018 | 139 887.58 | 140 702.01 | - 814.43 | -0.58% | 137 026.67 | 2 860.91 | 2.09% |
| 31.03.2018 | 140 702.01 | 140 866.49 | - 164.47 | -0.12% | 136 301.25 | 4 400.77 | 3.23% |
| 28.02.2018 | 140 866.49 | 141 660.74 | - 794.25 | -0.56% | 135 861.79 | 5 004.70 | 3.68% |
| 31.01.2018 | 141 660.74 | 141 830.67 | - 169.93 | -0.12% | 134 392.68 | 7 268.06 | 5.41% |
| 31.12.2017 | 141 830.67 | 142 560.72 | - 730.05 | -0.51% | 133 374.04 | 8 456.62 | 6.34% |
| 30.11.2017 | 142 560.72 | 140 782.06 | 1 778.66 | 1.26% | 132 419.14 | 10 141.58 | 7.66% |
| 31.10.2017 | 140 782.06 | 139 899.04 | 883.02 | 0.63% | 131 600.61 | 9 181.45 | 6.98% |
| 30.09.2017 | 139 899.04 | 139 948.33 | -49.28 | -0.04% | 131 145.91 | 8 753.14 | 6.67% |
| 31.08.2017 | 139 948.33 | 139 236.03 | 712.29 | 0.51% | 129 594.51 | 10 353.82 | 7.99% |
| 31.07.2017 | 139 236.03 | 138 285.39 | 950.64 | 0.69% | 128 463.90 | 10 772.13 | 8.39% |
| 30.06.2017 | 138 285.39 | 138 138.00 | 147.39 | 0.11% | 127 877.90 | 10 407.49 | 8.14% |
| 31.05.2017 | 138 138.00 | 137 026.67 | 1 111.32 | 0.81% | 127 501.56 | 10 636.43 | 8.34% |
| 30.04.2017 | 137 026.67 | 136 301.25 | 725.42 | 0.53% | 127 145.68 | 9 880.99 | 7.77% |
| 31.03.2017 | 136 301.25 | 135 861.79 | 439.46 | 0.32% | 127 164.17 | 9 137.08 | 7.19% |
| 28.02.2017 | 135 861.79 | 134 392.68 | 1 469.11 | 1.09% | 126 111.24 | 9 750.55 | 7.73% |
| 31.01.2017 | 134 392.68 | 133 374.04 | 1 018.64 | 0.76% | 125 237.14 | 9 155.54 | 7.31% |
| 31.12.2016 | 133 374.04 | 132 419.14 | 954.90 | 0.72% | 125 756.87 | 7 617.17 | 6.06% |
| 30.11.2016 | 132 419.14 | 131 600.61 | 818.53 | 0.62% | 130 021.34 | 2 397.80 | 1.84% |
| 31.10.2016 | 131 600.61 | 131 145.91 | 454.70 | 0.35% | 128 294.16 | 3 306.45 | 2.58% |
| 30.09.2016 | 131 145.91 | 129 594.51 | 1 551.40 | 1.20% | 126 276.83 | 4 869.08 | 3.86% |
| 31.08.2016 | 129 594.51 | 128 463.90 | 1 130.60 | 0.88% | 124 751.14 | 4 843.37 | 3.88% |
| 31.07.2016 | 128 463.90 | 127 877.90 | 586.00 | 0.46% | 124 404.33 | 4 059.57 | 3.26% |
| 30.06.2016 | 127 877.90 | 127 501.56 | 376.34 | 0.30% | 122 402.61 | 5 475.29 | 4.47% |
| 31.05.2016 | 127 501.56 | 127 145.68 | 355.88 | 0.28% | 122 242.29 | 5 259.28 | 4.30% |
| 30.04.2016 | 127 145.68 | 127 164.17 | -18.49 | -0.01% | 119 476.11 | 7 669.57 | 6.42% |
| 31.03.2016 | 127 164.17 | 126 111.24 | 1 052.92 | 0.83% | 117 381.61 | 9 782.56 | 8.33% |
| 29.02.2016 | 126 111.24 | 125 237.14 | 874.10 | 0.70% | 114 863.65 | 11 247.59 | 9.79% |
| 31.01.2016 | 125 237.14 | 125 756.87 | - 519.73 | -0.41% | 113 322.91 | 11 914.23 | 10.51% |
| 31.12.2015 | 125 756.87 | 130 021.34 | -4 264.47 | -3.28% | 110 003.29 | 15 753.59 | 14.32% |
| 30.11.2015 | 130 021.34 | 128 294.16 | 1 727.18 | 1.35% | 110 832.14 | 19 189.21 | 17.31% |
| 31.10.2015 | 128 294.16 | 126 276.83 | 2 017.33 | 1.60% | 107 942.00 | 20 352.16 | 18.85% |
| 30.09.2015 | 126 276.83 | 124 751.14 | 1 525.69 | 1.22% | 105 549.41 | 20 727.42 | 19.64% |
| 31.08.2015 | 124 751.14 | 124 404.33 | 346.81 | 0.28% | 103 914.90 | 20 836.24 | 20.05% |
| 31.07.2015 | 124 404.33 | 122 402.61 | 2 001.72 | 1.64% | 101 766.47 | 22 637.85 | 22.24% |
| 30.06.2015 | 122 402.61 | 122 242.29 | 160.32 | 0.13% | 100 147.99 | 22 254.62 | 22.22% |
| 31.05.2015 | 122 242.29 | 119 476.11 | 2 766.18 | 2.32% | 98 724.92 | 23 517.37 | 23.82% |
| 30.04.2015 | 119 476.11 | 117 381.61 | 2 094.50 | 1.78% | 97 035.15 | 22 440.96 | 23.13% |
| 31.03.2015 | 117 381.61 | 114 863.65 | 2 517.96 | 2.19% | 96 379.93 | 21 001.68 | 21.79% |
| 28.02.2015 | 114 863.65 | 113 322.91 | 1 540.74 | 1.36% | 95 647.59 | 19 216.06 | 20.09% |
| 31.01.2015 | 113 322.91 | 110 003.29 | 3 319.63 | 3.02% | 96 606.95 | 16 715.97 | 17.30% |
| 31.12.2014 | 110 003.29 | 110 832.14 | - 828.85 | -0.75% | 95 459.13 | 14 544.15 | 15.24% |
| 30.11.2014 | 110 832.14 | 107 942.00 | 2 890.13 | 2.68% | 94 007.34 | 16 824.79 | 17.90% |
| 31.10.2014 | 107 942.00 | 105 549.41 | 2 392.59 | 2.27% | 93 220.81 | 14 721.19 | 15.79% |
| 30.09.2014 | 105 549.41 | 103 914.90 | 1 634.51 | 1.57% | 92 104.24 | 13 445.17 | 14.60% |
| 31.08.2014 | 103 914.90 | 101 766.47 | 2 148.42 | 2.11% | 91 377.99 | 12 536.90 | 13.72% |
| 31.07.2014 | 101 766.47 | 100 147.99 | 1 618.49 | 1.62% | 91 383.40 | 10 383.07 | 11.36% |
| 30.06.2014 | 100 147.99 | 98 724.92 | 1 423.07 | 1.44% | 90 461.58 | 9 686.41 | 10.71% |
| 31.05.2014 | 98 724.92 | 97 035.15 | 1 689.77 | 1.74% | 90 644.46 | 8 080.45 | 8.91% |
| 30.04.2014 | 97 035.15 | 96 379.93 | 655.22 | 0.68% | 90 148.61 | 6 886.54 | 7.64% |
| 31.03.2014 | 96 379.93 | 95 647.59 | 732.34 | 0.77% | 89 528.62 | 6 851.31 | 7.65% |
| 28.02.2014 | 95 647.59 | 96 606.95 | - 959.36 | -0.99% | 88 641.76 | 7 005.83 | 7.90% |
| 31.01.2014 | 96 606.95 | 95 459.13 | 1 147.82 | 1.20% | 87 858.07 | 8 748.88 | 9.96% |
| 31.12.2013 | 95 459.13 | 94 007.34 | 1 451.79 | 1.54% | 86 510.83 | 8 948.30 | 10.34% |
| 30.11.2013 | 94 007.34 | 93 220.81 | 786.53 | 0.84% | 84 899.76 | 9 107.58 | 10.73% |
| 31.10.2013 | 93 220.81 | 92 104.24 | 1 116.58 | 1.21% | 83 970.46 | 9 250.36 | 11.02% |
| 30.09.2013 | 92 104.24 | 91 377.99 | 726.24 | 0.79% | 82 759.46 | 9 344.77 | 11.29% |
| 31.08.2013 | 91 377.99 | 91 383.40 | -5.41 | -0.01% | 81 583.24 | 9 794.75 | 12.01% |
| 31.07.2013 | 91 383.40 | 90 461.58 | 921.82 | 1.02% | 80 648.09 | 10 735.31 | 13.31% |
| 30.06.2013 | 90 461.58 | 90 644.46 | - 182.88 | -0.20% | 79 161.40 | 11 300.18 | 14.27% |
| 31.05.2013 | 90 644.46 | 90 148.61 | 495.85 | 0.55% | 75 383.61 | 15 260.86 | 20.24% |
| 30.04.2013 | 90 148.61 | 89 528.62 | 620.00 | 0.69% | 74 147.75 | 16 000.86 | 21.58% |
| 31.03.2013 | 89 528.62 | 88 641.76 | 886.86 | 1.00% | 73 875.96 | 15 652.66 | 21.19% |
| 28.02.2013 | 88 641.76 | 87 858.07 | 783.69 | 0.89% | 73 583.83 | 15 057.93 | 20.46% |
| 31.01.2013 | 87 858.07 | 86 510.83 | 1 347.24 | 1.56% | 73 418.99 | 14 439.08 | 19.67% |
| 31.12.2012 | 86 510.83 | 84 899.76 | 1 611.07 | 1.90% | 68 772.04 | 17 738.80 | 25.79% |
| 30.11.2012 | 84 899.76 | 83 970.46 | 929.31 | 1.11% | 47 205.54 | 37 694.22 | 79.85% |
| 31.10.2012 | 83 970.46 | 82 759.46 | 1 210.99 | 1.46% | 49 069.23 | 34 901.23 | 71.13% |
| 30.09.2012 | 82 759.46 | 81 583.24 | 1 176.23 | 1.44% | 48 842.08 | 33 917.38 | 69.44% |
| 31.08.2012 | 81 583.24 | 80 648.09 | 935.15 | 1.16% | 48 930.42 | 32 652.82 | 66.73% |
| 31.07.2012 | 80 648.09 | 79 161.40 | 1 486.69 | 1.88% | 48 508.52 | 32 139.57 | 66.26% |
| 30.06.2012 | 79 161.40 | 75 383.61 | 3 777.79 | 5.01% | 47 483.63 | 31 677.77 | 66.71% |
| 31.05.2012 | 75 383.61 | 74 147.75 | 1 235.85 | 1.67% | 46 793.65 | 28 589.95 | 61.10% |
| 30.04.2012 | 74 147.75 | 73 875.96 | 271.80 | 0.37% | 46 339.26 | 27 808.49 | 60.01% |
| 31.03.2012 | 73 875.96 | 73 583.83 | 292.13 | 0.40% | 46 416.64 | 27 459.31 | 59.16% |
| 29.02.2012 | 73 583.83 | 73 418.99 | 164.84 | 0.22% | 44 239.60 | 29 344.23 | 66.33% |
| 31.01.2012 | 73 418.99 | 68 772.04 | 4 646.96 | 6.76% | 43 721.13 | 29 697.87 | 67.93% |
| 31.12.2011 | 68 772.04 | 47 205.54 | 21 566.49 | 45.69% | 44 194.73 | 24 577.30 | 55.61% |
| 30.11.2011 | 47 205.54 | 49 069.23 | -1 863.68 | -3.80% | 41 430.30 | 5 775.25 | 13.94% |
| 31.10.2011 | 49 069.23 | 48 842.08 | 227.15 | 0.47% | 41 599.74 | 7 469.48 | 17.96% |
| 30.09.2011 | 48 842.08 | 48 930.42 | -88.33 | -0.18% | 41 520.50 | 7 321.59 | 17.63% |
| 31.08.2011 | 48 930.42 | 48 508.52 | 421.90 | 0.87% | 40 889.15 | 8 041.27 | 19.67% |
| 31.07.2011 | 48 508.52 | 47 483.63 | 1 024.89 | 2.16% | 39 455.06 | 9 053.46 | 22.95% |
| 30.06.2011 | 47 483.63 | 46 793.65 | 689.98 | 1.47% | 38 512.21 | 8 971.42 | 23.30% |
| 31.05.2011 | 46 793.65 | 46 339.26 | 454.39 | 0.98% | 38 240.44 | 8 553.21 | 22.37% |
| 30.04.2011 | 46 339.26 | 46 416.64 | -77.38 | -0.17% | 39 346.74 | 6 992.52 | 17.77% |
| 31.03.2011 | 46 416.64 | 44 239.60 | 2 177.04 | 4.92% | 38 550.90 | 7 865.75 | 20.40% |
| 28.02.2011 | 44 239.60 | 43 721.13 | 518.47 | 1.19% | 37 464.68 | 6 774.93 | 18.08% |
| 31.01.2011 | 43 721.13 | 44 194.73 | - 473.61 | -1.07% | 37 144.50 | 6 576.62 | 17.71% |
| 31.12.2010 | 44 194.73 | 41 430.30 | 2 764.43 | 6.67% | 37 138.70 | 7 056.04 | 19.00% |
| 30.11.2010 | 41 430.30 | 41 599.74 | - 169.44 | -0.41% | 36 182.07 | 5 248.23 | 14.51% |
| 31.10.2010 | 41 599.74 | 41 520.50 | 79.25 | 0.19% | 36 322.93 | 5 276.81 | 14.53% |
| 30.09.2010 | 41 520.50 | 40 889.15 | 631.35 | 1.54% | 35 441.44 | 6 079.06 | 17.15% |
| 31.08.2010 | 40 889.15 | 39 455.06 | 1 434.09 | 3.63% | 35 424.44 | 5 464.71 | 15.43% |
| 31.07.2010 | 39 455.06 | 38 512.21 | 942.85 | 2.45% | 34 656.71 | 4 798.35 | 13.85% |
| 30.06.2010 | 38 512.21 | 38 240.44 | 271.77 | 0.71% | 34 237.97 | 4 274.23 | 12.48% |
| 31.05.2010 | 38 240.44 | 39 346.74 | -1 106.30 | -2.81% | 32 125.80 | 6 114.64 | 19.03% |
| 30.04.2010 | 39 346.74 | 38 550.90 | 795.85 | 2.06% | 32 706.60 | 6 640.14 | 20.30% |
| 31.03.2010 | 38 550.90 | 37 464.68 | 1 086.22 | 2.90% | 33 085.78 | 5 465.12 | 16.52% |
| 28.02.2010 | 37 464.68 | 37 144.50 | 320.17 | 0.86% | 33 928.10 | 3 536.58 | 10.42% |
| 31.01.2010 | 37 144.50 | 37 138.70 | 5.81 | 0.02% | 35 479.77 | 1 664.73 | 4.69% |
| 31.12.2009 | 37 138.70 | 36 182.07 | 956.63 | 2.64% | 36 150.22 | 988.48 | 2.73% |
| 30.11.2009 | 36 182.07 | 36 322.93 | - 140.86 | -0.39% | - | - | - |
| 31.10.2009 | 36 322.93 | 35 441.44 | 881.49 | 2.49% | - | - | - |
| 30.09.2009 | 35 441.44 | 35 424.44 | 17.00 | 0.05% | - | - | - |
| 31.08.2009 | 35 424.44 | 34 656.71 | 767.73 | 2.22% | - | - | - |
| 31.07.2009 | 34 656.71 | 34 237.97 | 418.74 | 1.22% | - | - | - |
| 30.06.2009 | 34 237.97 | 32 125.80 | 2 112.18 | 6.57% | - | - | - |
| 31.05.2009 | 32 125.80 | 32 706.60 | - 580.80 | -1.78% | - | - | - |
| 30.04.2009 | 32 706.60 | 33 085.78 | - 379.18 | -1.15% | - | - | - |
| 31.03.2009 | 33 085.78 | 33 928.10 | - 842.32 | -2.48% | - | - | - |
| 28.02.2009 | 33 928.10 | 35 479.77 | -1 551.67 | -4.37% | - | - | - |
| 31.01.2009 | 35 479.77 | 36 150.22 | - 670.45 | -1.85% | - | - | - |
| 31.12.2008 | 36 150.22 | - | - | - | - | - | - |
Graf jako obrázek

Podobné sestavy
Aplikace Ekonomika ČNB ze sekce makroekonomika zobrazuje časové řady hlavních makroekonomických údajů z ekonomiky ČR. Najdete zde přes 10.000 grafů různých hodnot od úrokových sazeb, přes statistiky státního rozpočtu, statistiky ČNB a data zpracovávaná ČSÚ. Data jsou k dispozici obvykle za posledních více než 20 let, od prosince roku 1992. Zdroj dat: ČNB ARAD

