SESFOD@10 – credit terms and conditions in euro-denominated securities financing and over-the-counter derivatives markets since 2013
Published as part of the ECB Economic Bulletin, Issue 6/2023.
Credit terms and conditions are an essential component of financing conditions and central to determining market participants’ risk appetite. Financing conditions affect market participants’ investment decisions. Looser credit terms and conditions may favour the build-up of leverage and increased risk-taking in the financial system. Building on the lessons from the global financial crisis, the ECB has been running the three-monthly survey on credit terms and conditions in euro-denominated securities financing and over-the-counter derivatives markets (SESFOD) since March 2013.[1]
Securities financing transactions (SFTs) are secured transactions in which assets are exchanged for cash. In economic terms, SFTs represent a loan which is collateralised by assets (e.g. bonds or shares). SFTs encompass four different transaction types: repurchase agreements (repos), securities lending, buy/sell back transactions and margin lending.[2] Euro-denominated repo transactions currently represent the largest segment of the euro money market with an outstanding amount of around €2 trillion at the end of 2022. Secured trades have become more popular since the financial crisis owing to a greater preference for mitigating counterparty risk through collateralisation. In addition to providing secured funding, repo transactions also enable market participants to source specific securities. Lastly, the secured money market segment plays a central role in monetary policy implementation and transmission, as does the unsecured money market segment.[3]
Over-the-counter (OTC) derivatives are financial instruments whose price depends on an underlying asset and which are traded outside of regulated exchanges. Derivatives are financial contracts linked to the fluctuation in the price of an underlying asset or a basket of assets (e.g. interest rates instruments, equities or commodities). OTC derivatives - which are privately negotiated and not traded on an exchange - accounted for almost 32% of the euro-denominated derivatives markets with a total gross notional outstanding amount of €41 trillion at the end of 2022. Financial derivatives are used, among other things, for risk management, hedging, arbitrage between markets and speculation.[4] Derivatives have a significant impact on the real economy, from mortgages to food prices.
SESFOD is part of an international initiative to collect information on the credit terms and conditions offered by firms operating in the wholesale markets. These markets are also important conduits for leverage in the financial system. SESFOD sheds light on potential risks associated with securities financing and derivatives markets, while also serving as a valuable monitoring and potential early warning tool by identifying significant changes in credit terms and conditions. Lastly, information on changes in the cost and availability of funding in wholesale markets, and in repo markets in particular, may support the analysis of monetary policy transmission and interbank funding conditions.[5]
SESFOD can be seen as the market-based counterpart to the euro area bank lending survey (BLS).[6] The ECB conducts several surveys[7], among which both SESFOD and the BLS focus, in part, on credit conditions. SESFOD studies credit terms for SFTs and OTC derivatives, whereas the BLS provides information on bank lending conditions for firms and households in the euro area.
On the tenth anniversary of SESFOD, this article illustrates the developments and drivers of counterparty credit terms and conditions based on participants’ responses over time.
1 Background to the survey
SESFOD, which was developed as part of an international initiative[8], is a predominantly qualitative survey of the activities of a sample of large banks and dealers in securities financing and over-the-counter (OTC) derivative markets. SESFOD participants are large banks and dealers headquartered in both euro area and non-euro area countries. The SESFOD panel currently consists of 27 banks. Box 1 looks at the representativeness of the survey participants in terms of their footprint in the relevant euro-denominated markets. In the aftermath of the 2008 global financial crisis, a study group of the Committee on the Global Financial System (CGFS) recommended conducting a qualitative survey on credit terms and conditions.[9] This resulted in major global central banks using equivalent survey structures. The results from such surveys provide the basis for international comparisons. Box 2 compares responses on hedge funds from SESFOD with those from the Federal Reserve’s Senior Credit Officer Opinion Survey on dealer financing terms (SCOOS).
SESFOD covers the markets that facilitated higher leverage and risk-taking in the lead-up to the global financial crisis. Prior to 2007, the non-bank financial system (sometimes referred to as the shadow banking system) enabled the build-up of leverage and allowed increasing interconnectedness within the financial system. SFT and OTC derivative markets played a key role in these developments. SESFOD was designed to monitor risks arising from increased interconnectedness, excessive financial leverage, vulnerability to procyclicality, “repo runs” and financial conditions.
SESFOD qualitative results enrich and complement the more recently available granular data on the covered markets. Since the survey was launched, new datasets have become available which provide granular insights into the markets covered by SESFOD. These datasets include data collected under the European Market Infrastructure Regulation (EMIR), the Securities Financing Transactions Regulation (SFTR) and Money Market Statistical Reporting (MMSR).[10] However, while price terms could be monitored through these datasets to some extent, SESFOD offers insights on non-price terms. The monitoring of non-price terms (e.g. credit limits or covenants and triggers) through quantitative datasets is much more challenging and costly. At the same time, as experienced during the global financial crisis[11], changes in non-price terms may have a much more adverse impact than changes in price terms (e.g. haircuts or initial margin requirements).
SESFOD also provides a forward-looking perspective that cannot be offered by regulatory data. SESFOD includes questions seeking qualitative information on the future direction of credit terms for different counterparty types or on the availability of (unutilised) leverage at hedge funds. Surveyed banks are asked about their outlook, which is later compared with actual market developments. The reliability of forward-looking information is one of the focus points in Section 4
2 Survey structure
SESFOD is structured in three parts spanning different counterparty types and market segments.[12] The first part covers credit terms across counterparty types in both SFT and OTC derivatives markets, while the second focuses on financing conditions against different types of collateral in SFT markets. The third part deals with financing conditions based on the type of underlying asset classes in OTC derivatives transactions.[13]
Credit terms are reported from the perspective of the dealer banks participating in the survey as suppliers of credit; they are differentiated between price and non-price terms and by counterparty types. Banks participating in SESFOD report changes in the credit terms they apply to SFT and OTC derivatives transactions with counterparties belonging to one of six counterparty types: (i) banks and dealers, which are the main financial intermediaries in wholesale markets; (ii) hedge funds; (iii) insurance companies; (iv) investment funds (including exchange-traded funds), pension plans and other institutional investment pools; (v) non-financial corporations; and (vi) sovereigns. In addition to the counterparty breakdown, credit terms are also differentiated into price and non-price terms. Price terms refer to the compensation demanded for bearing risk, e.g. financing rates or spreads; non-price terms refer to contractual provisions used to mitigate risk exposures, e.g. haircuts, provisions on the maximum maturity of funding, covenants and triggers. To the extent that credit terms have tightened or eased, respondents are asked to provide up to three of the most important reasons why their price and non-price credit terms have changed across the entire spectrum of securities financing and OTC derivatives transaction types, selecting from a given list of eight reasons.[14]
Aggregate survey results are expressed in net percentages of respondents. For each question, survey respondents choose from five options, for example: (i) tightened considerably; (ii) tightened somewhat; (iii) remained basically unchanged; (iv) eased somewhat; and (v) eased considerably. Net percentages are calculated as the difference between the percentage of respondents reporting “tightened considerably” or “tightened somewhat” and those reporting “eased somewhat” and “eased considerably”.
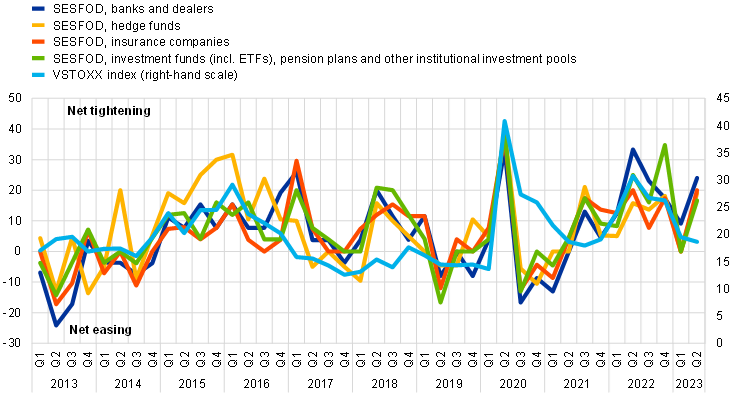
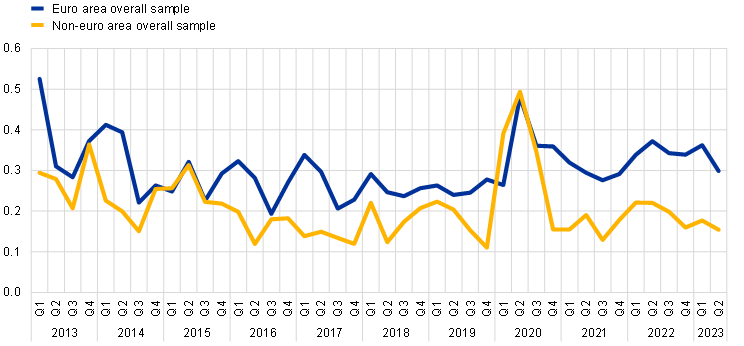
The time series of aggregate survey results since the survey launch in March 2013 enables a comparison of SESFOD results with relevant market indicators. Comparing SESFOD for the main financial intermediary counterparty types with the Euro Stoxx 50 Volatility Index (VSTOXX) illustrates that SESFOD results for financial counterparties tracked the VSTOXX index rather closely. Moreover, after some dispersion in credit terms across financial counterparties in the earlier part of the survey period, credit terms have moved in line in recent years (Chart 1, panel a).
Comparisons are also possible with the results of other surveys such as the BLS. Since the information covered by both ECB surveys also includes credit conditions for non-financial entities, it is possible to compare results from the SESFOD survey with those of the BLS. Overall credit terms for non-financial counterparties in SESFOD are not always aligned with BLS credit standards for euro area firms. Credit conditions from SESFOD are more volatile when compared with the credit standards reported in the BLS. Moreover, SESFOD results have pointed to a tightening in most quarters since 2015, whereas BLS results moved to a consistent tightening only as of 2022 and have been signalling mostly easing credit standards between 2014 and 2019 (Chart 1, panel b).
Chart 1
SESFOD and BLS aggregate survey results and VSTOXX index
a) Financial SESFOD counterparties and VSTOXX index
(left-hand scale: net percentages of responses; right-hand scale: index)
b) Non-financial SESFOD counterparties and BLS
(left-hand scale: net percentages of responses; right-hand scale: index)
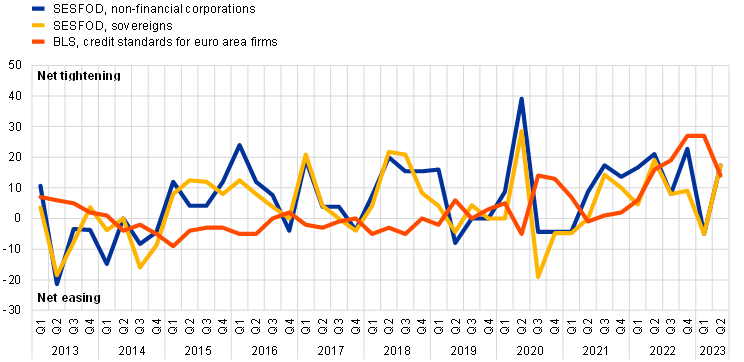
Sources: SESFOD, Eurex, and ECB calculations.
Note: For the VSTOXX index the median value over the SESFOD reporting periods is shown.
The time series of responses since the survey launch in March 2013 provide a rich basis for assessing the range of opinions among participating banks. The mapping of qualitative answers into numerical scores allows us to compute several statistics and to gauge the aggregate information collected by SESFOD.[15] In a nutshell, dispersion across responding banks on single questions can be aggregated at the survey round level or by question theme. This approach can also be applied to subgroups of respondents, typically broken down by their jurisdiction or the national location of the headquarter. This analysis is presented in Section 3.
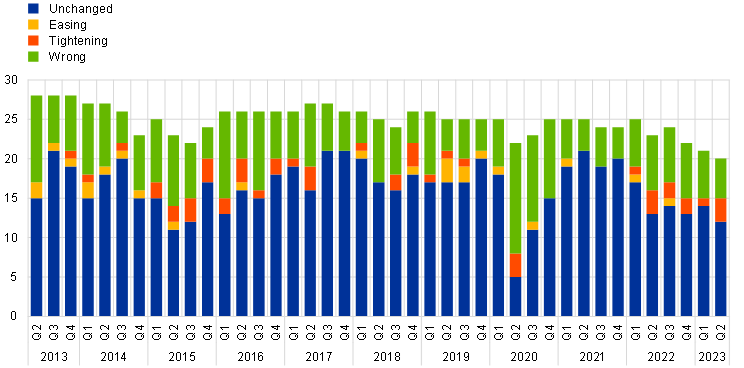
As the predominant response has been “remained basically unchanged”, the net percentages – as aggregate indicators of survey results – have often been based on a small number of responses either side of the response spectrum.For each survey since 2013, an average 88% of responses indicated that conditions were basically unchanged. This average is lower for questions on counterparty credit terms and highest for those on uncleared OTC derivatives (Chart 2). Given the predominance of these responses among a relatively small set of participants, we need to ensure that survey findings are not consistently driven by a subset of (individual) respondents or by the geographic domicile of the respondents.
Chart 2
SESFOD responses indicating basically no change
(percentages)
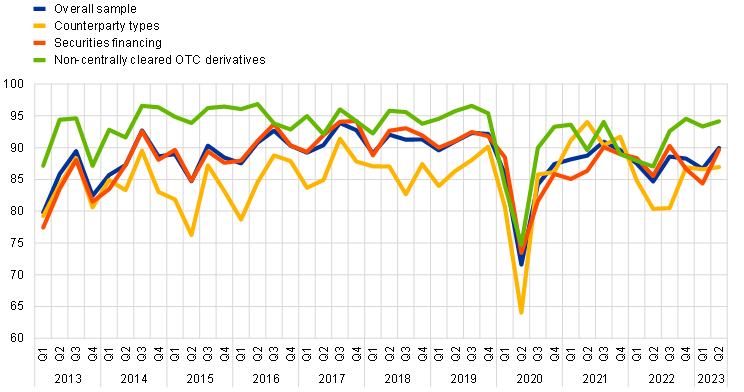
Sources: SESFOD and ECB calculations.
Note: For each survey round, the average of the share of “remained basically unchanged” responses received for the 342 SESFOD questions (or for the questions in a subsection of the questionnaire) is calculated and displayed over time.
3 Drivers of changes in bank responses
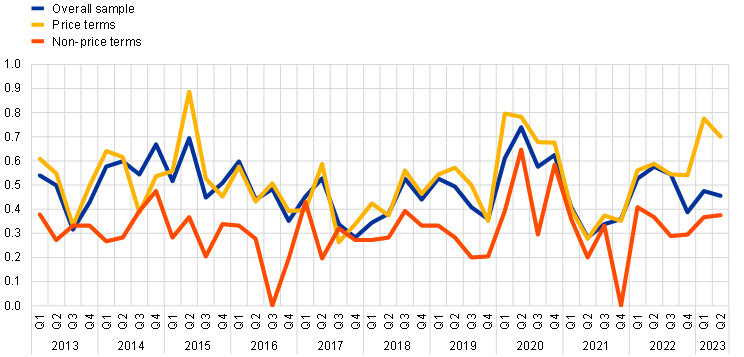
Participant opinions differ more on questions about price terms than on ones about non-price terms (Chart 3, panel a). Bank responses vary based on the questions and the geographic area of the survey participants. The standard deviation for responses to questions on price terms is higher than for those on non-price terms. Credit terms and conditions not only reflect considerations about counterparty credit risk management, but also considerations about balance sheet availability, market liquidity and competitive pressures, etc. These are further documented in Section 5. Moreover, the non-price terms and conditions agreed with established counterparties in relation to transactions or financial instruments guided by e.g. International Swaps and Derivatives Association (ISDA) agreements are adjusted very infrequently.
Views have diverged more among participants headquartered in the euro area than among participants headquartered elsewhere (Chart 3, panel b). The jurisdiction breakdown reveals a persistent difference in dispersion within groups. The most likely factors driving this wedge are differences in customer bases and in full access to the Eurosystem liquidity facilities. For the former, euro area banks compete for many small and medium-sized enterprises (SMEs), while non-euro area groups focus on larger, global clients in the “blue chips” echelon.
Chart 3
Opinion dispersion indicator by theme
a) Price and non-price terms
(standard deviation)
b) Domicile
(standard deviation)
Sources: SESFOD and ECB calculations.
Note: Surveyed banks’ individual responses to a question are translated into numerical scores ranging from -2 to +2. The standard deviation is then computed using the numerical scores across all surveyed banks’ responses. The standard deviations for a subgroup of questions is then aggregated for a point of time taking the average.
4 Bank expectations versus outcomes
SESFOD assesses counterparty credit terms from both a backward-looking and a forward-looking perspective. For predetermined counterparty types and for all counterparties, SESFOD asks respondents to assess overall, price and non-price credit terms over the preceding three months and to share their expectations for these terms over the forthcoming three months. This section assesses the degree to which expectations expressed by participants at the individual (micro) and at the aggregate (macro) levels have leading indicator properties.
Individual participants predominantly and correctly anticipate unchanged counterparty credit terms, while only rarely correctly anticipating directional changes. Incorrect anticipations were more common for price than for non-price terms: on average, respondents correctly anticipated unchanged price and non-price terms in 67.7% and 83.7% of the cases respectively. Moreover, respondents’ expectations were on average directionally wrong in 28.5% of the cases for price terms and in 14.2% of the cases for non-price terms. Correctly anticipated directional changes were more often correct on the tightening side (5.1% of the cases for price and 2.1% for non-price terms) than on the easing side (2.4% and 0.9%) (Chart 4).
Chart 4
Expectations of individual respondents and realised outcomes
a) Price terms
(number of responses by direction and accuracy)
b) Non-price terms
(number of responses by direction and accuracy)
Sources: SESFOD, and ECB calculations.
Note: Respondents’ expectations from the previous review period are evaluated against the direction that was actually realised over the review period.
Aggregate expectations have consistently displayed leading indicator properties (Chart 5). Aggregate opinions, often described as the “wisdom of the crowd”, could balance out individual underperformances and deliver higher accuracy. On average, respondents have rightly anticipated the overall credit terms across counterparty types in 76% of the cases. In 24% of the cases, respondents’ anticipations did not materialise without erring either on the easing or on the tightening side. In 13% of the cases, the observed credit terms tightened less than expected, whereas in 11% of the cases they eased less than expected. This good aggregate anticipation might be driven by poor individual expectations balancing each other out, or also by self-fulfilling expectations and endogeneity, as SESFOD participants are large market participants.
Chart 5
Aggregate expectations versus realisations – SESFOD leading indicator properties
a) Time series of actual and expected changes
(aggregate net percentage of survey respondents, shifted to following survey period for expected changes)
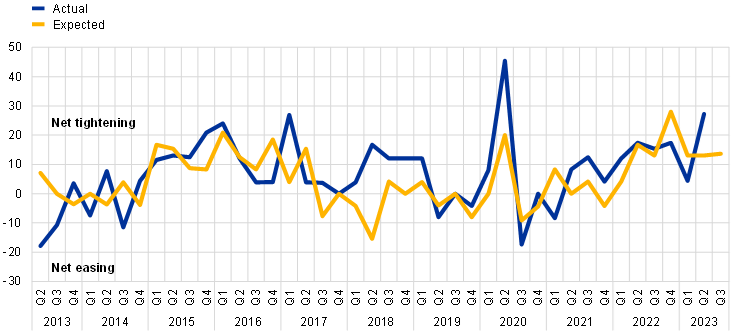
b) Accuracy of expectations
(percentages)
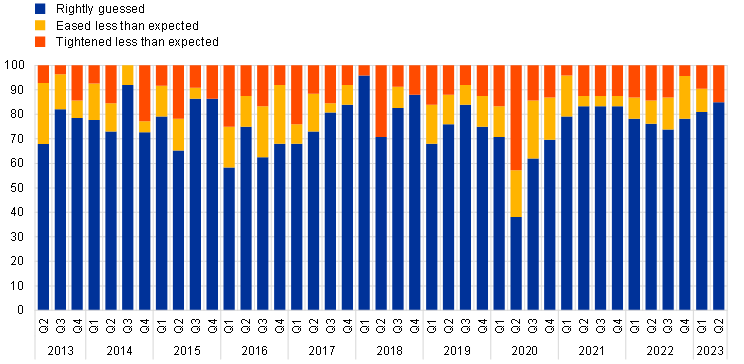
Sources: SESFOD, and ECB calculations.
Notes: Actual variation comes from questions in which market participants are asked to assess the change in overall conditions over the past three months, while expectations are derived by asking them to guess what conditions will be like in the following three months.
5 Drivers behind changes in counterparty credit terms and conditions
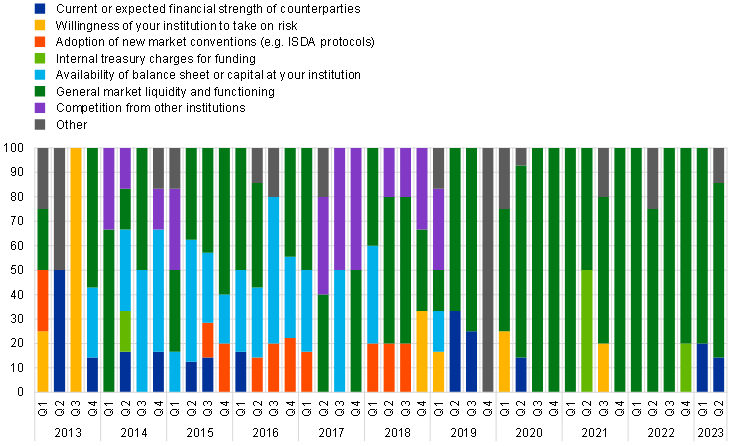
Survey responses may reveal cyclicality in the relative importance of drivers of credit terms and conditions or may be indicative of underlying structural market developments. Respondents are asked to provide the three most relevant drivers behind an easing or tightening in credit terms as appropriate by selecting from a list of eight options. Analysing these responses over time reveals that some of these drivers are cyclical (e.g. the role of general market liquidity and functioning) (Chart 6, panel a). Beyond this cyclicality, the recurring mention of individual drivers as the most relevant reasons for tightening or easing can help identify structural trends in markets.
General market liquidity and functioning as well as competition from other institutions have been identified as the main drivers influencing price and non-price terms over the life of SESFOD. Since the start of SESFOD, survey participants have named general market liquidity and functioning as the main driver for an easing or tightening of price and non-price terms. Additionally, competition from other institutions and availability of balance sheet space were consistently mentioned by the surveyed banks (Chart 6, panel a). For price terms applied to transactions with bank and dealer counterparties, responses show that balance sheet availability and the adoption of new market conventions, in particular during the early implementation phases of Basel III, were important drivers in the early years of SESFOD. In line with the results for all counterparties, general market liquidity and functioning has had the main impact on price terms in recent years (Chart 6, panel b).
Chart 6
Drivers of survey price credit terms for all counterparties and for banks and dealers
a) All counterparties – reasons for tightening and easing
(left-hand scale: number of responses by driver; right-hand scale: percentages)
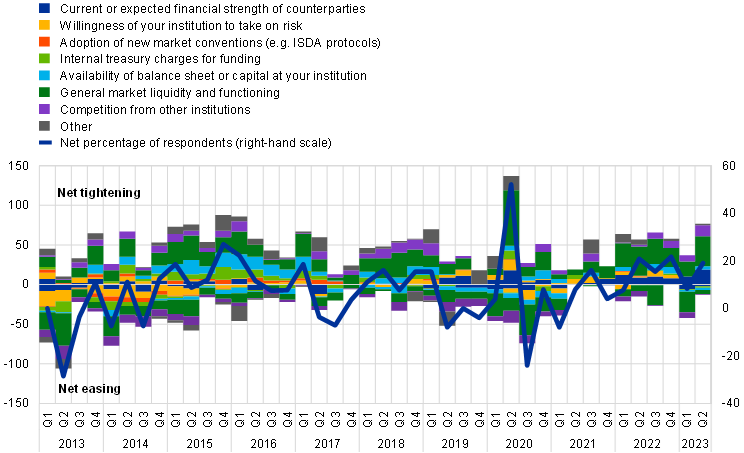
b) Banks and dealers – reasons for tightening
(percentages)
Sources: SESFOD and ECB calculations.
6 Concluding remarks
SESFOD surveys a small but representative sample of market participants. The analysis of responses since the launch of the survey in 2013 validates the conduct and use of the survey for financial stability (as it shows increases in risk-taking and build-up of leverage), for market functioning and for monetary policy (as it shows changes to financing conditions).
- The infrequent changes, along with the “wisdom of the crowd” phenomenon observed for developments in price and non-price credit terms, emphasise the value of the qualitative SESFOD information as a warning light for future unfavourable developments.
- Coupling the qualitative survey with quantitative regulatory reporting data will further enrich the assessment of credit terms in euro-denominated SFT and uncleared OTC derivatives markets and enable a better understanding of the financing conditions prevailing in financial markets.
Box 1
Market structure and sample representativeness
Prepared by Emanuele Franceschi, Piotr Kotlarz, Valentina Macchiati and Philippe Molitor
The value of SESFOD for policymaking relies on the representativeness of SESFOD participants for the underlying market segments. On launching SESFOD, the ECB selected participants on the basis of balance sheet and market information and feedback from EU national authorities. The participant sample has remained broadly stable since the launch of SESFOD and currently consists of 27 major banking groups located inside and outside the euro area. This box provides quantitative evidence using regulatory reporting information under the Securities Financing Transactions Regulation (SFTR) and European Market Infrastructure Regulation (EMIR) to validate this selection and its representativeness in terms of activities in euro-denominated securities financing and over-the-counter (OTC) derivatives markets. The information and data are also used to illustrate the relative importance of different collateral types in securities financing transactions (SFT) markets and of instrument types in derivatives markets.
SFT markets
The transaction-level dataset under the Securities Financing Transaction Regulation (SFTR) requires any EU-based entity engaging in securities financing transactions to report such transactions to trade repositories. The SFTR separately covers repurchase agreements (repos) and buy/sell-backs, securities lending and borrowing, as well as margin lending. It thus provides almost universal coverage of European market participants’ financial activities in the covered market segments.
SESFOD banking groups lend about €1.3 trillion via repo and represent approximately 60% of the entire euro-denominated repo funding market (Chart A). This share has been remarkably stable over recent SESFOD reference periods and supports the representativeness of the SESFOD sample in securities financing transactions markets. SESFOD participants headquartered in the euro area represent around 70% of the survey participants’ market footprint and their share is slowly increasing.
Chart A
SESFOD footprint in the European repo market is sizeable and stable
(left-hand scale: EUR trillions; right-hand scale: percentages)
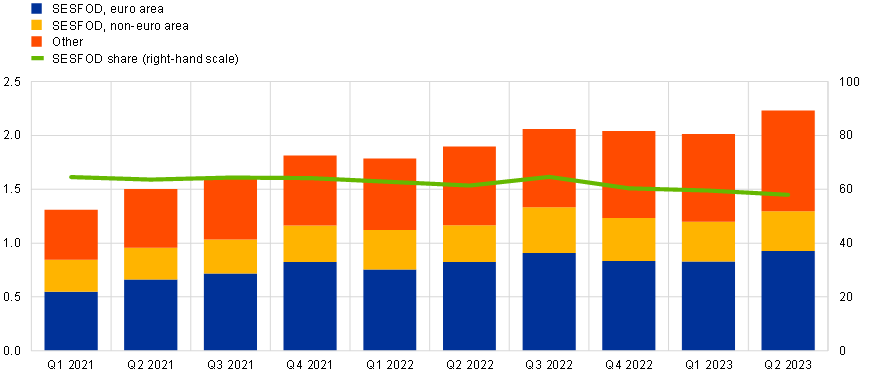
Sources: Securities Financing Transactions Data Store (SFTDS), Global Legal Entity Identifier Foundation (GLEIF), ESCB’s Register of Institutions and Affiliates Data (RIAD), and ECB calculations.
Notes: Values are computed as medians over daily values within each three-month reference period. SESFOD participants’ values represent those of their whole banking group. Geographical location is assigned by the headquarter of each banking group. The sample is restricted to euro-denominated repo and buy/sell-back lending from SESFOD participants and overall euro repo lending reported under the SFTR.
In most cases, SESFOD participants supply funds against government debt. In secured financing transactions, counterparties exchange liquid funds against collateral. The entities or banks supplying funds receive a security in exchange and agree to sell it back when the repo contract matures. Under the SFTR, detailed information is collected about the collateral backing repo transactions. For SESFOD participants, public debt – issued either by central governments or supranational entities – is by far the most common type of collateral and it is used to back about 90% of total repo transactions by volume (Chart B). Collateral in the form of debt securities issued by financial or non-financial corporations is of relatively minor importance in securing securities financing transactions.
Chart B
SESFOD participants receive mostly public debt as collateral
(percentages)
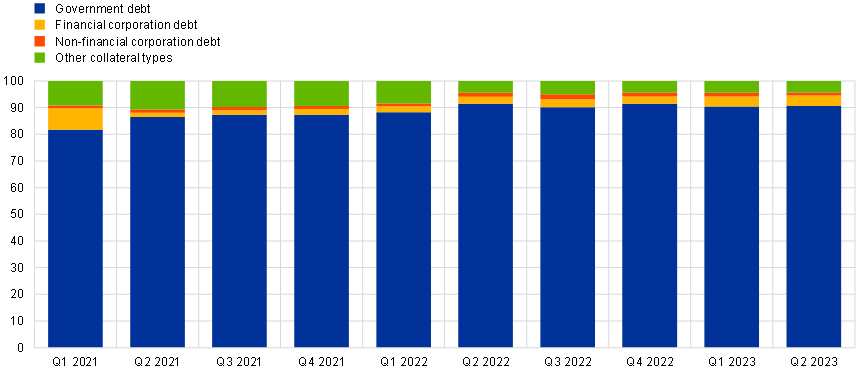
Sources: SFTDS, Centralised Securities Database (CSDB) and ECB calculations.
Notes: Government debt includes national and supranational government debt securities, financial corporation debt includes banks and NBFI entities, non-financial corporation debt includes bonds issued by any other corporation. Other collateral types include securities related to equities, indexes and all residual assets. Values exclusively represent transactions where SESFOD participants supply liquidity against collateral. Shares are computed on the repo spot value, i.e. the liquidity provided. Values are three-month medians over daily values. The sample is restricted to euro-denominated repo and buy/sell-back lending from SESFOD participants and overall euro repo lending reported under the SFTR.
Derivative markets
The European Market Infrastructure Regulation (EMIR) requires European entities to report on derivatives transactions, both when they take place bilaterally (OTC) or are cleared by a central counterparty (CCP). For example, banks use derivatives to hedge against various risks, hence the considerable variety of derivative types, such as currency and interest rates fluctuations, commodities and equities volatility, or credit risk. Also, some large banks provide derivatives market access to non-bank financial institutions and act as gateways for them.[16]
The derivatives market is one of the largest financial markets and is key to assessing risk appetite. Totalling a gross notional amount of more than €120 trillion for the European market, it is mainly made up of interest rate and foreign exchange derivatives, by far the most of which are traded by banks. The EMIR thus sheds light on the risk behaviour and potential build-up of synthetic leverage in financial markets.
SESFOD surveys inform on shifts and trends in OTC markets and risk attitudes. The qualitative and directional information from SESFOD rounds provides useful insights into risk build-up and favoured clearing behaviour. The combination of information on actual behaviour from EMIR and qualitative information from SESFOD allows a comprehensive assessment of the European derivative market.
SESFOD representativeness of derivatives is good, with some heterogeneity. Transactions carried out by SESFOD participants average at about 40% of the whole European market in the first quarter of 2023 (Chart C, panel a). As is the case for data on securities financing transactions, this footprint takes into account the full ownership structure of the banking groups, as ultimate holdings only occasionally enter into derivatives transactions, while branches and subsidiaries located in specialised markets are more active.
SESFOD participants based in the euro area cover relatively more of the cleared market. This is possibly because they make up the largest share of European banks in the survey, but it also reflects the regulatory measures taken since 2008. Indeed, the SESFOD footprint in centrally cleared transactions stands at about 8% for non-European banks, while it triples above 24% for European banking groups, totalling more than 33%. On the other hand, SESFOD covers more than two-thirds of the OTC market, split in 24% for euro area banks and 43% for non-euro area groups.
The SESFOD survey represents 45% of the interest rate derivative market, the largest segment. With a notional gross amount of just below €119 trillion (Chart C, panel b), interest rate derivatives are by far the largest segment in the market, and banks are often relevant players due to their natural exposure to rate fluctuations. While the coverage is larger for OTC transactions, the overall coverage points to a good representativeness of SESFOD. Indeed, the worst performing segment in terms of footprint is the residual “Other” in OTC transactions, which gathers less frequently traded contracts. In this space, SESFOD participants represent about 8% of roughly €250 billion in notional terms.
Chart C
SESFOD participants trade relatively few derivatives
a) Relative market shares by derivative type and participant group
(percentages)
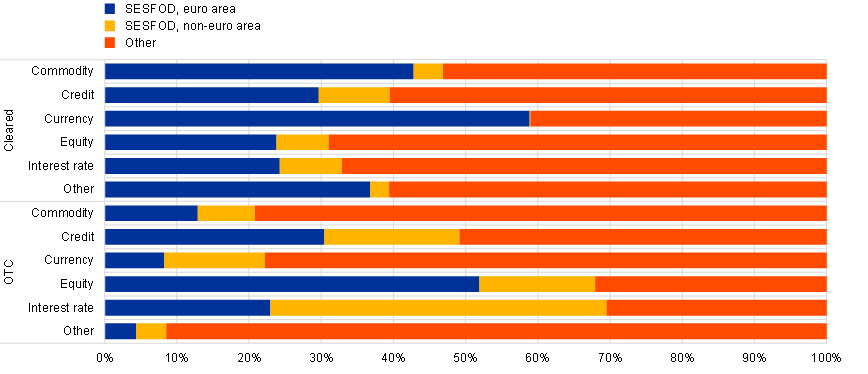
b) Absolute market shares by derivative type and participant group
(EUR trillions)
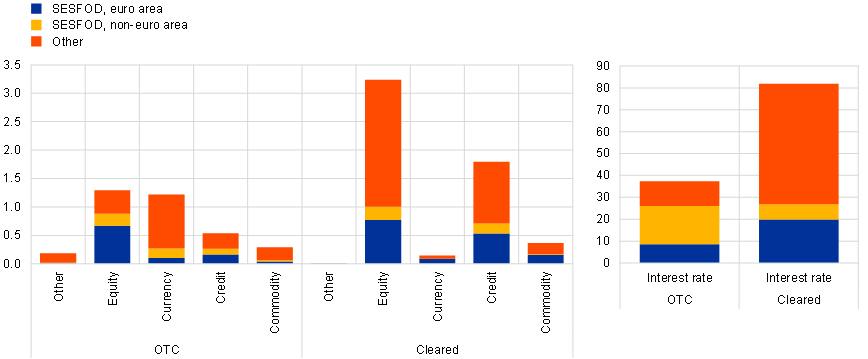
Sources: EMIR and ECB calculations.
Notes: Values represent gross notional seller amounts for SESFOD participants over the period from 1 December 2022 to 28 February 2023. They are three-month median values computed on daily aggregated data for each subcategory. The sample is restricted to euro-denominated derivatives sold by SESFOD participants and overall euro-denominated derivatives reported in EMIR over the same period.
Concluding remarks
Regulatory reports corroborate the representativeness of SESFOD surveys. SFTR and EMIR data enable close benchmarking and monitoring of the footprint of SESFOD participants, in almost real time. The results of this exercise are valuable and corroborate the policy value of SESFOD, particularly in respect of the qualitative, non-price information. Comparing the surveys’ answers with actual data can indeed provide useful insights on the transmission from risk appetite and expectations to realised price conditions and inform policy decisions.
Box 2
Comparison between SESFOD and SCOOS responses on hedge funds
Prepared by Simon Kördel and Philippe Molitor
The SESFOD questions largely mirror questions in the Federal Reserve’s Senior Credit Officer Opinion Survey (SCOOS) on dealer financing terms for US dollar-denominated transactions, while being tailored in some aspects to the situation and needs in the euro area. The setups of SESFOD and SCOOS are aligned with each other and with the recommendation of the Committee on the Global Financial System (CGFS). However, some aspects consider the regional situations. For example, the selection of counterparty types accounts for the role and size of specific financial subsectors active in the markets falling under the scope of SESFOD and SCOOS respectively. This box compares results of the SESFOD with its US counterpart, focusing on credit terms as well as leverage in the hedge funds sector.
Hedge funds drove leverage developments and risk-taking in the financial system in the run-up to the global financial crisis. The CGFS identified a lack of information on financing conditions in secured lending and OTC derivatives, including on leverage developments in the hedge funds sector, as a blind spot for policymakers and analysts.[17] The qualitative information from SESFOD and SCOOS is essential in identifying early warnings of developing vulnerabilities.
Hedge funds play a more prominent role in the United States than in the euro area financial system. Even though the total assets under management by euro area-based hedge funds have nearly tripled to around €520 billion since the launch of SESFOD, the hedge fund sector in the euro area is still relatively small when compared with that in the United States which has assets under management of €2.5 trillion (Chart A).[18]
Chart A
Hedge funds total assets in the United States and in the euro area
(EUR trillions)
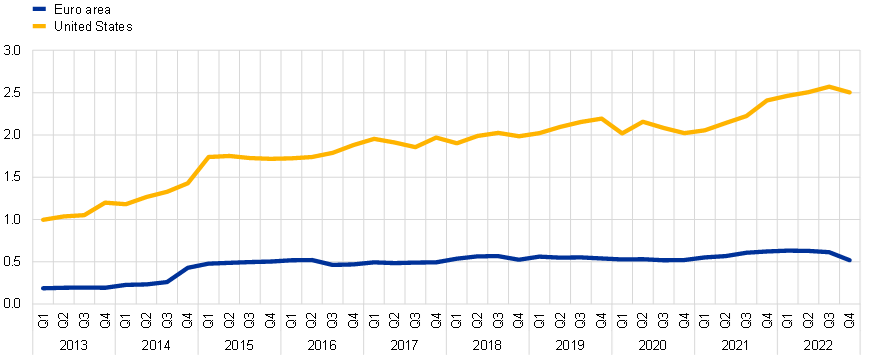
Sources: Board of Governors of the Federal Reserve System, ECB and ECB calculations.
Price and non-price terms offered to hedge funds
Price and non-price terms offered to hedge funds as reported by SESFOD and SCOOS participants showed overall similar developments with a tendency towards easier credit terms in the United States in the period from 2016 to 2019 (Chart A). Both price and non-price terms of hedge fund counterparties as reported in SESFOD and SCOOS have generally moved in line with each other since the launch of SESFOD in 2013. In the years between 2016 and 2019 SCOOS participants reported easier price and non-price terms compared to their SESFOD counterparts. This must be seen against the background of overall looser financial conditions in the United States during that period.
Chart B
Price and non-price terms for hedge fund counterparties in the euro area and in the United States
a) Price terms
(net percentage of survey respondents)
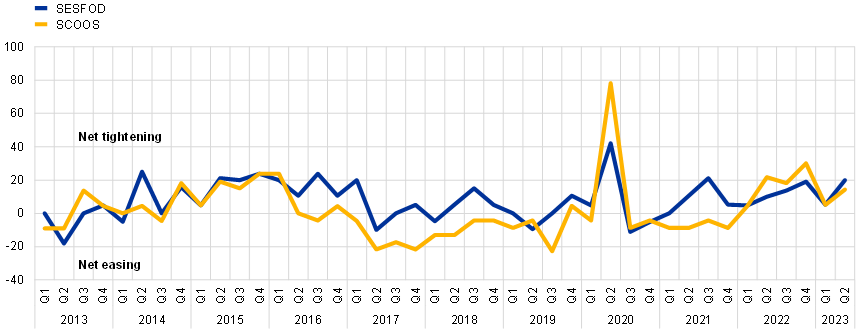
b) Non-price terms
(EUR trillions)
Source: Board of Governors of the Federal Reserve System, ECB and ECB calculations.
Use and availability of leverage
The two surveys also include questions on the availability and the use of financial leverage by hedge funds. Aside from questions regarding the credit terms in SFT and OTC derivative markets, SESFOD and SCOOS also include questions regarding the use of financial leverage by some counterparties, especially hedge funds, as well as the availability of financial leverage at hedge funds. This information can be used to identify early warnings of developing vulnerabilities and the build-up of leverage.
The available (and unutilised) leverage of hedge funds displays some leading indicator properties on the future use of leverage (Chart C). The availability of unutilised leverage reported by survey participants can be interpreted as an expectation that this leverage will be used in the future. This can be used as a leading indicator. Since the launch of SESFOD, the availability and the use of financial leverage reported by respondents in both surveys has developed in a broadly similar way, with the exception of the years after the start of the COVID-19 pandemic, during which SCOOS participants reported decreases in the use of leverage up until early 2023, whereas SESFOD participants already reported an increased use of leverage in the third quarter of 2020.
Chart C
Availability of (unutilised) leverage at hedge funds as expectation for actual use of leverage
(percentages)
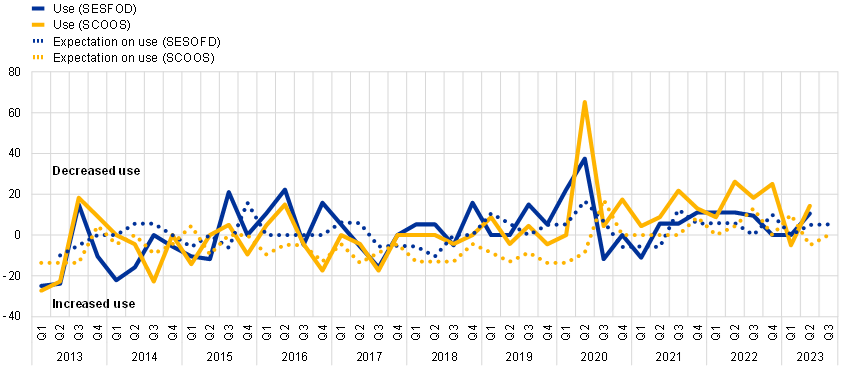
Sources: SESFOD, SCOOS and ECB calculations.
Notes: Availability of (unutilised) leverage at hedge funds is displayed as an expectation for the use of leverage by hedge funds in the subsequent reference period (e.g. expectations on use values in the second quarter are the values for the availability of (unutilised) leverage in the first quarter). The net percentage is defined as the difference between the percentage of respondents reporting "decreased considerably" or "decreased somewhat" and those reporting "increased somewhat" and "increased considerably")
Concluding remarks
The comparison of SESFOD and SCOOS results for hedge funds illustrates the existence of similar developments across the United States and the euro area. The findings validate the use of the qualitative survey information for analyses of potential spillover channels for market developments and systemic risks.
-
See the special feature entitled “New ECB Survey on Credit Terms and Conditions in Euro-denominated Securities Financing and Over-the-Counter Derivatives Markets (SESFOD)”, Financial Stability Review, ECB, May 2013.
-
For definitions, see Article 3 of the Regulation (EU) 2015/2365 of the European Parliament and of the Council of 25 November 2015 on transparency of securities financing transactions and of reuse and amending Regulation (EU) No 648/2012 (OJ L 337, 23.12.2015, p. 1).
-
Analyses that drew on SESFOD information include Section 2.1 in the Financial Stability Review, ECB, November 2019 and the boxes entitled “Recent trends in credit terms and conditions in euro-denominated securities financing and over-the-counter derivatives markets based on information from the SESFOD survey”, Financial Stability Review, ECB, November 2018 and “Interconnectedness of derivatives markets and money market funds through insurance corporations and pension funds”, Financial Stability Review, ECB, November 2020.
-
The Bank of Canada, the Bank of England and the Federal Reserve System conduct similar surveys but only the Federal Reserve publishes aggregated results. See Senior Credit Officer Opinion Survey on Dealer Financing Terms.
-
See Committee on the Global Financial System, “The role of margin requirements and haircuts in procyclicality”, CGFS Papers, No 36, BIS, March 2010.
-
Data collection under EMIR started in 2012, MMSR in 2016 and SFTR in 2020.
-
The standard survey template includes 342 questions which are broadly similar to those asked in surveys by other central banks, enabling a comparison among jurisdictions (see Box 2).
-
Additionally, the first and last survey round of the year includes “special questions” regarding long-term trends and market making. The survey may also include ad hoc special questions such as those asked in June 2020 regarding financing conditions at the outset of the pandemic or in March 2022 regarding energy derivatives.
-
See also the SESFOD guidelines, ECB, 2016, or Financial Stability Review, ECB, May 2013, op. cit.
-
Using the example above, tightened considerably is assigned a numerical score of +2, tightened somewhat +1, remained basically unchanged 0, eased somewhat -1, and eased considerably -2.
-
See the feature entitled “Key linkages between banks and the non-bank financial sector”, Financial Stability Review, ECB, May 2023.
-
See Committee on the Global Financial System, “The role of margin requirements and haircuts in procyclicality”, CGFS Papers, No 36, BIS, March 2010.
-
The fact that European hedge funds assets only represent a fraction of US hedge funds does not change when accounting for total assets of the UK hedge fund sector. Hedge funds based in the United Kingdom also engage in financial transactions or in markets falling within the scope of SESFOD. In particular non-euro area SESFOD participants reflect developments in these transactions in their responses.
Poslední zprávy z rubriky Makroekonomika:
Přečtěte si také:

Prezentace
26.04.2024 Historie a vývoj vodovodních baterií: Od...
25.04.2024 Pobřeží Egejského moře - ideální tip na všechny...
24.04.2024 Výsledková sezóna: Jak se daří výrobcům čipů a...
Okénko investora

Olívia Lacenová, Wonderinterest Trading Ltd.
Dlouho očekávaná událost ze světa kryptoměn. Přinese další halving bitcoinu nová maxima?

Štěpán Křeček, BHS

Petr Lajsek, Purple Trading

Ali Daylami, BITmarkets

Michal Brothánek, AVANT IS

Miroslav Novák, AKCENTA
Spotřebitelská inflace v eurozóně odeznívá, pro služby to však úplně neplatí

Jiří Cimpel, Cimpel & Partneři

Jakub Petruška, Zlaťáky.cz

