Volume of securities trades for clients, total - ekonomika ČNB
Aktualizace dat Volume of securities trades for clients, total v této aplikaci skončila 30.6.2023. Aktualizovná data časových řad najdete na stránkách nové aplikace z dat ARAD ČNB
Nové časové řady makroekonomiky a jejich data
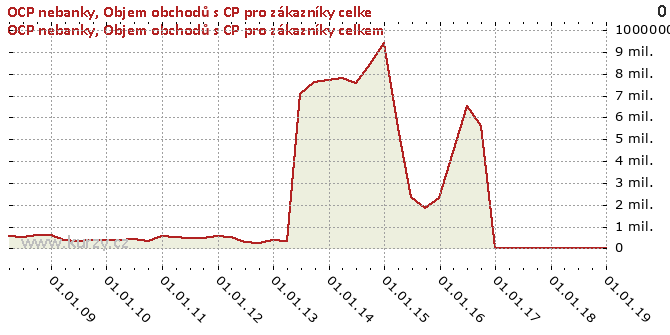
Graf hodnot, Investment firms - non-banks
Meziroční srovnání
Minima a maxima
| Typ | Období | Hodnota |
|---|---|---|
| Max | 31.12.2014 | 9 431 401.00 |
| Min | 30.09.2012 | 266 190.00 |
Historické hodnoty
| Období | Hodnota | Předchozí | Rozdíl | Změna | Před rokem | Rozdíl | Změna |
|---|---|---|---|---|---|---|---|
| 31.12.2018 | 0.00 | 0.00 | 0.00 | - | 0.00 | 0.00 | - |
| 30.09.2018 | 0.00 | 0.00 | 0.00 | - | 0.00 | 0.00 | - |
| 30.06.2018 | 0.00 | 0.00 | 0.00 | - | 0.00 | 0.00 | - |
| 31.03.2018 | 0.00 | 0.00 | 0.00 | - | 0.00 | 0.00 | - |
| 31.12.2017 | 0.00 | 0.00 | 0.00 | - | 0.00 | 0.00 | - |
| 30.09.2017 | 0.00 | 0.00 | 0.00 | - | 5 627 738.00 | -5 627 738.00 | - |
| 30.06.2017 | 0.00 | 0.00 | 0.00 | - | 6 531 165.00 | -6 531 165.00 | - |
| 31.03.2017 | 0.00 | 0.00 | 0.00 | - | 4 436 537.00 | -4 436 537.00 | - |
| 31.12.2016 | 0.00 | 5 627 738.00 | -5 627 738.00 | - | 2 316 834.00 | -2 316 834.00 | - |
| 30.09.2016 | 5 627 738.00 | 6 531 165.00 | - 903 427.00 | -13.83% | 1 845 640.00 | 3 782 098.00 | 204.92% |
| 30.06.2016 | 6 531 165.00 | 4 436 537.00 | 2 094 628.00 | 47.21% | 2 372 113.00 | 4 159 052.00 | 175.33% |
| 31.03.2016 | 4 436 537.00 | 2 316 834.00 | 2 119 703.00 | 91.49% | 5 524 804.00 | -1 088 267.00 | -19.70% |
| 31.12.2015 | 2 316 834.00 | 1 845 640.00 | 471 194.00 | 25.53% | 9 431 401.00 | -7 114 567.00 | -75.43% |
| 30.09.2015 | 1 845 640.00 | 2 372 113.00 | - 526 473.00 | -22.19% | 8 434 264.00 | -6 588 624.00 | -78.12% |
| 30.06.2015 | 2 372 113.00 | 5 524 804.00 | -3 152 691.00 | -57.06% | 7 581 889.00 | -5 209 776.00 | -68.71% |
| 31.03.2015 | 5 524 804.00 | 9 431 401.00 | -3 906 597.00 | -41.42% | 7 801 278.00 | -2 276 474.00 | -29.18% |
| 31.12.2014 | 9 431 401.00 | 8 434 264.00 | 997 137.00 | 11.82% | 7 725 212.00 | 1 706 189.00 | 22.09% |
| 30.09.2014 | 8 434 264.00 | 7 581 889.00 | 852 375.00 | 11.24% | 7 608 449.00 | 825 815.00 | 10.85% |
| 30.06.2014 | 7 581 889.00 | 7 801 278.00 | - 219 389.00 | -2.81% | 7 089 726.00 | 492 163.00 | 6.94% |
| 31.03.2014 | 7 801 278.00 | 7 725 212.00 | 76 066.00 | 0.98% | 321 506.00 | 7 479 772.00 | 2 326.48% |
| 31.12.2013 | 7 725 212.00 | 7 608 449.00 | 116 763.00 | 1.53% | 379 040.00 | 7 346 172.00 | 1 938.10% |
| 30.09.2013 | 7 608 449.00 | 7 089 726.00 | 518 723.00 | 7.32% | 266 190.00 | 7 342 259.00 | 2 758.28% |
| 30.06.2013 | 7 089 726.00 | 321 506.00 | 6 768 220.00 | 2 105.16% | 282 163.00 | 6 807 563.00 | 2 412.63% |
| 31.03.2013 | 321 506.00 | 379 040.00 | -57 534.00 | -15.18% | 541 596.00 | - 220 090.00 | -40.64% |
| 31.12.2012 | 379 040.00 | 266 190.00 | 112 850.00 | 42.39% | 562 503.00 | - 183 463.00 | -32.62% |
| 30.09.2012 | 266 190.00 | 282 163.00 | -15 973.00 | -5.66% | 498 540.00 | - 232 350.00 | -46.61% |
| 30.06.2012 | 282 163.00 | 541 596.00 | - 259 433.00 | -47.90% | 494 994.00 | - 212 831.00 | -43.00% |
| 31.03.2012 | 541 596.00 | 562 503.00 | -20 907.00 | -3.72% | 541 099.00 | 497.00 | 0.09% |
| 31.12.2011 | 562 503.00 | 498 540.00 | 63 963.00 | 12.83% | 568 499.00 | -5 996.00 | -1.05% |
| 30.09.2011 | 498 540.00 | 494 994.00 | 3 546.00 | 0.72% | 319 436.00 | 179 104.00 | 56.07% |
| 30.06.2011 | 494 994.00 | 541 099.00 | -46 105.00 | -8.52% | 415 690.00 | 79 304.00 | 19.08% |
| 31.03.2011 | 541 099.00 | 568 499.00 | -27 400.00 | -4.82% | 379 643.00 | 161 456.00 | 42.53% |
| 31.12.2010 | 568 499.00 | 319 436.00 | 249 063.00 | 77.97% | 369 932.00 | 198 567.00 | 53.68% |
| 30.09.2010 | 319 436.00 | 415 690.00 | -96 254.00 | -23.16% | 398 978.00 | -79 542.00 | -19.94% |
| 30.06.2010 | 415 690.00 | 379 643.00 | 36 047.00 | 9.49% | 341 903.00 | 73 787.00 | 21.58% |
| 31.03.2010 | 379 643.00 | 369 932.00 | 9 711.00 | 2.62% | 407 217.00 | -27 574.00 | -6.77% |
| 31.12.2009 | 369 932.00 | 398 978.00 | -29 046.00 | -7.28% | 596 251.00 | - 226 319.00 | -37.96% |
| 30.09.2009 | 398 978.00 | 341 903.00 | 57 075.00 | 16.69% | 600 690.00 | - 201 712.00 | -33.58% |
| 30.06.2009 | 341 903.00 | 407 217.00 | -65 314.00 | -16.04% | 510 089.00 | - 168 186.00 | -32.97% |
| 31.03.2009 | 407 217.00 | 596 251.00 | - 189 034.00 | -31.70% | 557 128.00 | - 149 911.00 | -26.91% |
| 31.12.2008 | 596 251.00 | 600 690.00 | -4 439.00 | -0.74% | - | - | - |
| 30.09.2008 | 600 690.00 | 510 089.00 | 90 601.00 | 17.76% | - | - | - |
| 30.06.2008 | 510 089.00 | 557 128.00 | -47 039.00 | -8.44% | - | - | - |
| 31.03.2008 | 557 128.00 | - | - | - | - | - | - |
Graf jako obrázek

Podobné sestavy
Aplikace Ekonomika ČNB ze sekce makroekonomika zobrazuje časové řady hlavních makroekonomických údajů z ekonomiky ČR. Najdete zde přes 10.000 grafů různých hodnot od úrokových sazeb, přes statistiky státního rozpočtu, statistiky ČNB a data zpracovávaná ČSÚ. Data jsou k dispozici obvykle za posledních více než 20 let, od prosince roku 1992. Zdroj dat: ČNB ARAD

