US National Weather Service (weather.gov)
27.12.2023 14:29:00
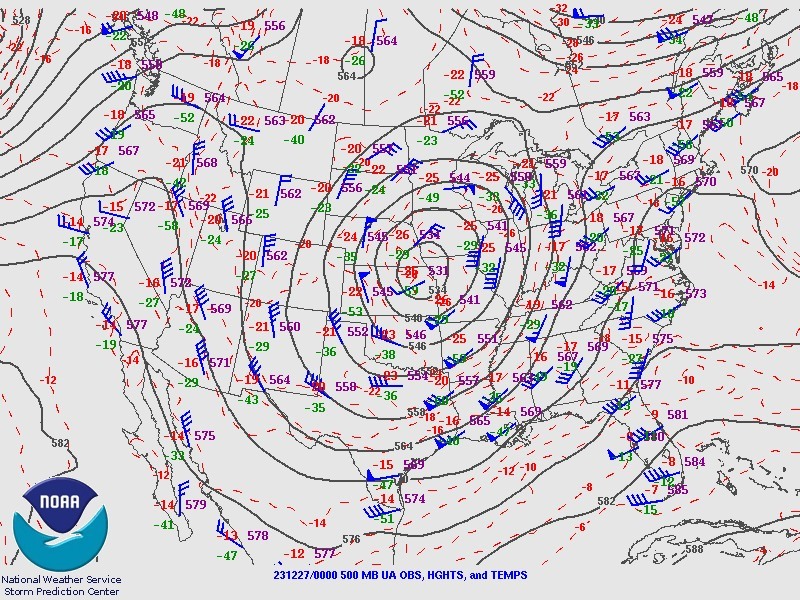
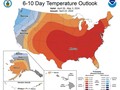
The cinnamon roll is still swirling. This image is a mid-level upper-air chart at 500 millibars
12/27/23 AM The cinnamon roll is still swirling! 🍥
This image is a mid-level upper-air chart at 500 millibars. The contours represent lines of constant thickness: lower values (purple 3-digit #'s) = cooler air (red 2-digit #'s). Here, we have a closed Low over the Central US that'll steadily dip SE & bring us chillier/drier weather late this week thru the weekend.
|
|

Weather searching weather forecast for all cities in the world.
The second option is to search through list of continents and countries.
