Euro area quarterly balance of payments and international investment position: third quarter of 2023
- Current account surplus at €175 billion (1.2% of euro area GDP) in four quarters to third quarter of 2023, after a €19 billion deficit (0.1% of GDP) a year earlier
- Geographical counterparts: largest bilateral current account surpluses vis-a-vis United Kingdom (€170 billion) and Switzerland (€71 billion) and largest deficits vis-a-vis China (€134 billion) and the United States (€16 billion)
- International investment position showed net assets of €327 billion (2.3% of euro area GDP) at the end of third quarter of 2023
Current account
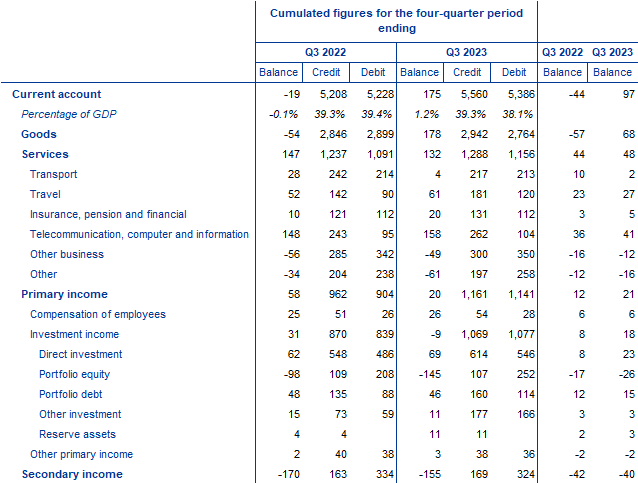
The current account of the euro area recorded a surplus of €175 billion (1.2% of euro area GDP) in the four quarters to the third quarter of 2023, after recording a deficit of €19 billion (0.1% of GDP) a year earlier (Table 1). This development was mainly driven by a switch from a deficit (€54 billion) to a surplus for goods (€178 billion) and, to a lesser extent, by a smaller deficit for secondary income (down from €170 billion to €155 billion). These developments were partly offset by reductions in the surpluses for primary income (down from €58 billion to €20 billion) and for services (down from €147 billion to €132 billion).
The lower surplus for services was due to a falling surplus for transport services (from €28 billion to €4 billion) and a widening deficit for other services (from €34 billion to €61 billion). Larger surpluses were recorded for telecommunication, computer and information services (from €148 billion to €158 billion), insurance, pension and financialservices (from €10 billion to €20 billion) and travel services (from €52 billion to €61 billion), while the deficit on other business services declined (from €56 billion to €49 billion).
The decrease in the primary income surplus was mainly due to a larger deficit in portfolio equity income (from €98 billion to €145 billion), while larger surpluses were recorded in direct investment income (from €62 billion to €69 billion) and in reserve asset income (from €4 billion to €11 billion).
Table 1
Current account of the euro area
Source: ECB.
Notes: “Equity” comprises equity and investment fund shares. Discrepancies between totals and their components may arise from rounding.
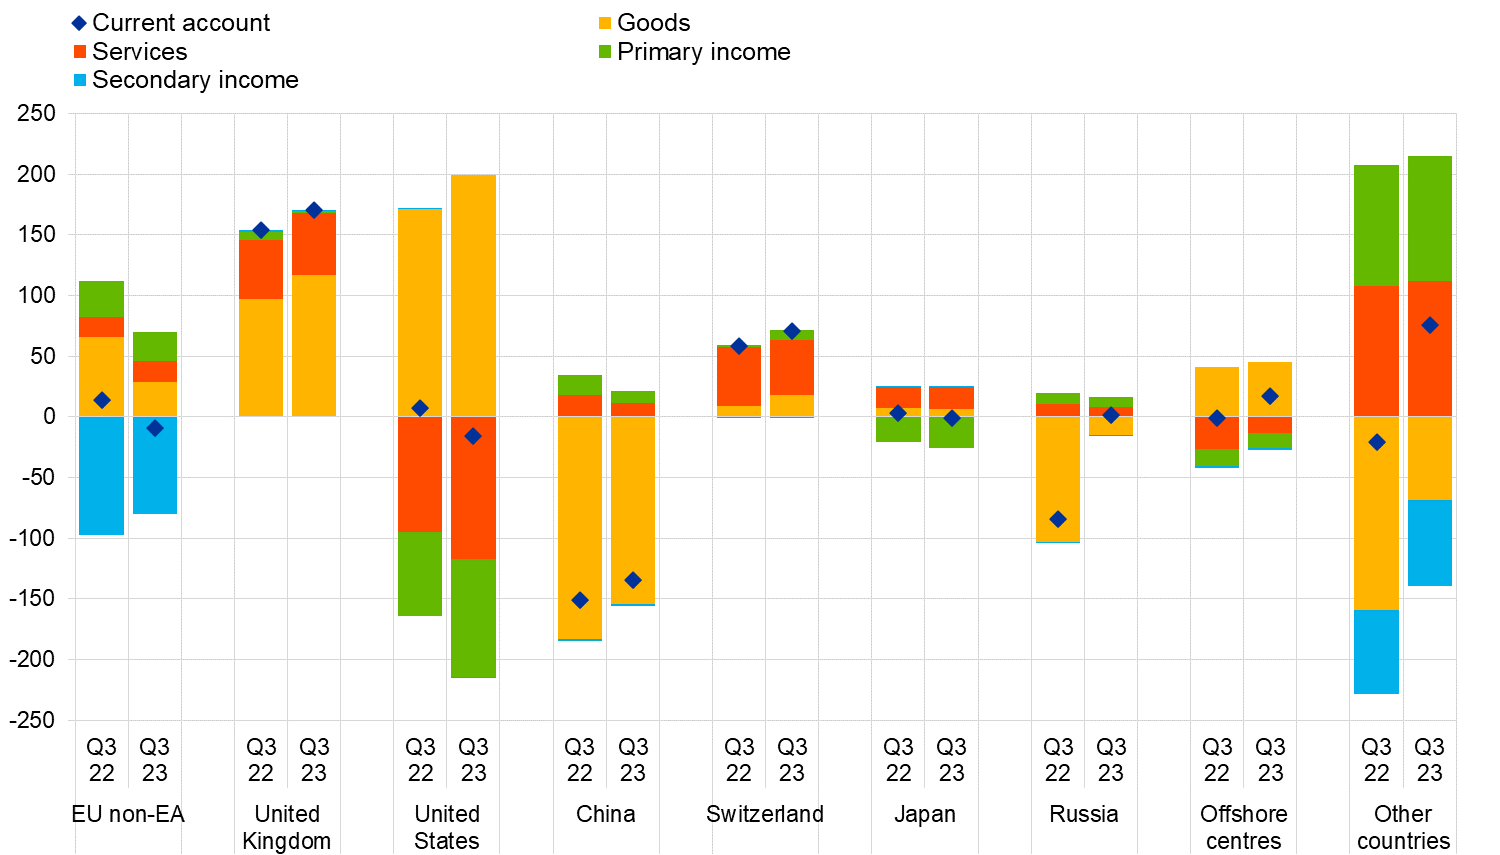
Data on the geographical counterparts of the euro area current account (Chart 1) show that, in the four quarters to the third quarter of 2023, the euro area recorded its largest bilateral surpluses vis-a-vis the United Kingdom (€170 billion, up from €154 billion a year earlier) and Switzerland (€71 billion, up from €59 billion). The euro area also recorded a surplus of €76 billion vis-a-vis the residual group of other countries, following a deficit of €21 billion a year earlier. The largest bilateral deficits were recorded vis-a-vis China (€134 billion, down from €151 billion a year earlier) and the United States (€15 billion, following a surplus of €7 billion).
The most significant changes in the geographical components of the current account in the four quarters to the third quarter of 2023 relative to the previous year were as follows. The goods deficits declined vis-a-vis Russia (from €103 billion to €15 billion), China (from €183 billion to €154 billion) and vis-a-vis the residual group of other countries (from €159 billion to €69 billion). The latter was partly due to a lower goods deficit with Norway (from €71 billion to €48 billion), a larger surplus with Türkiye (from €8 billion to €23 billion) and lower imports from countries within the Organization of the Petroleum Exporting Countries. The surplus in goods vis-a-vis EU Member States and EU institutions outside the euro area decreased from €65 billion to €29 billion, while it increased vis-a-vis the United States from €171 billion to €200 billion.
In services, the deficit vis-a-vis the United States increased (from €95 billion to €117 billion), while the deficit vis-a-vis offshore centres declined (from €27 billion to €13 billion). In primary income, a larger deficit was recorded vis-a-vis the United States (from €70 billion to €98 billion), while the deficit in secondary income vis-a-vis the EU Member States and EU institutions outside the euro area decreased (from €98 billion to €80 billion).
Chart 1
Geographical breakdown of the euro area current account balance
(four-quarter moving sums in EUR billions; non-seasonally adjusted)
Source: ECB.
Note: “EU non-EA” comprises the non-euro area EU Member States and those EU institutions and bodies that are considered for statistical purposes as being outside the euro area, such as the European Commission and the European Investment Bank. “Other countries” includes all countries and country groups not shown in the chart, as well as unallocated transactions.
International investment position
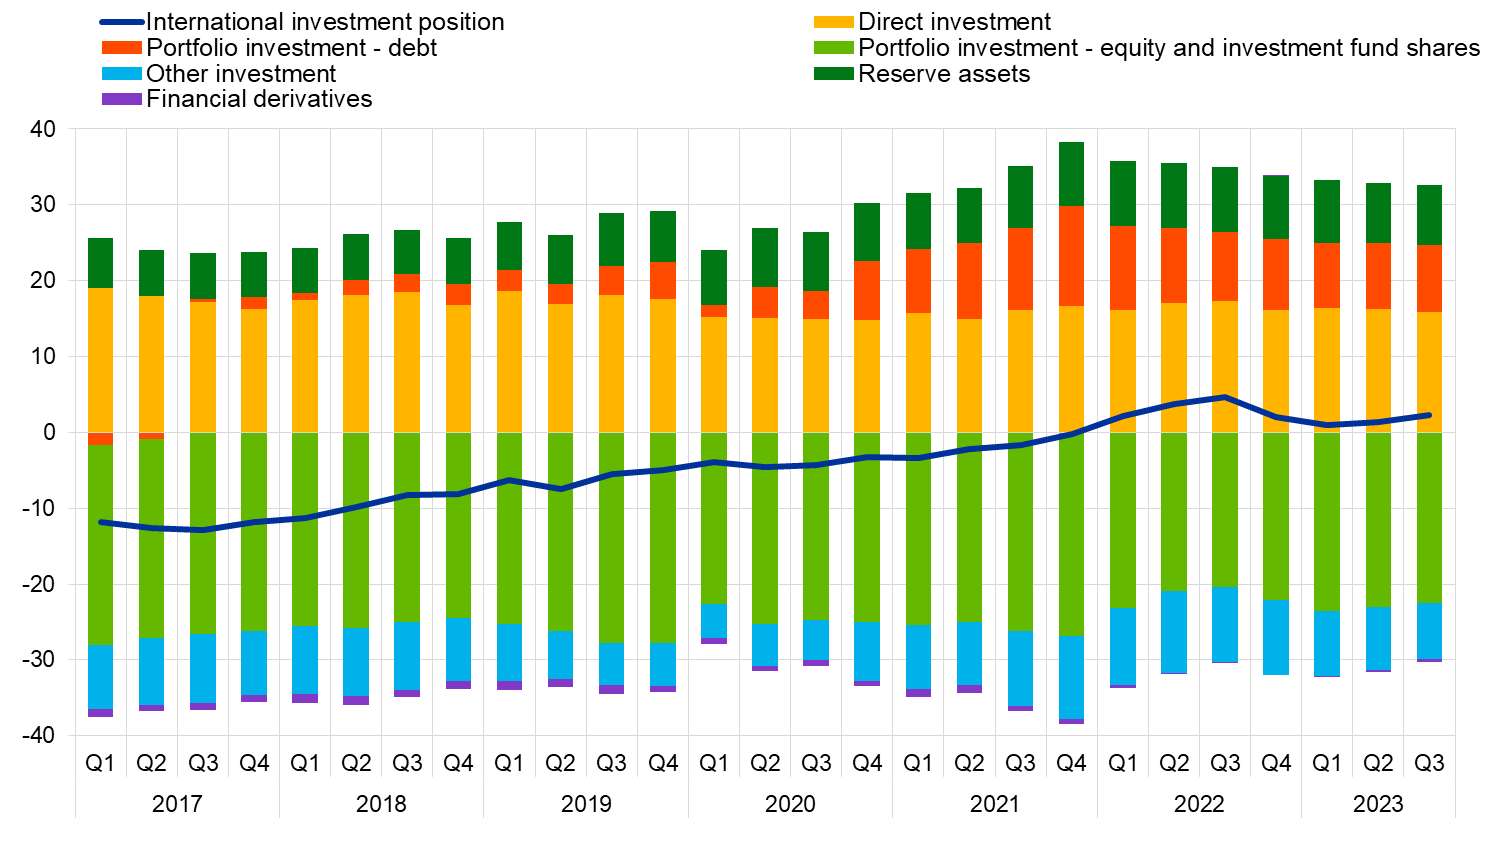
At the end of the third quarter of 2023, the international investment position of the euro area recorded net assets of €327 billion vis-a-vis the rest of the world (2.3% of euro area GDP), up from €184 billion in the previous quarter (Chart 2 and Table 2).
Chart 2
Net international investment position of the euro area
(net amounts outstanding at the end of the period as a percentage of four-quarter moving sums of GDP)
Source: ECB.
The €143 billion increase in net assets was mainly driven by lower net liabilities in other investment (down from €1.17 trillion to €1.03 trillion). Moreover, larger net assets were recorded in portfolio debt (up from €1.21 trillion to €1.24 trillion), while net liabilities in portfolio equity declined (from €3.21 trillion to €3.19 trillion). These developments were partly offset by lower net assets in direct investment (down from €2.28 trillion to €2.25 trillion).
Table 2
International investment position of the euro area
(EUR billions, unless otherwise indicated; amounts outstanding at the end of the period, flows during the period; non-working day and non-seasonally adjusted)
Source: ECB.
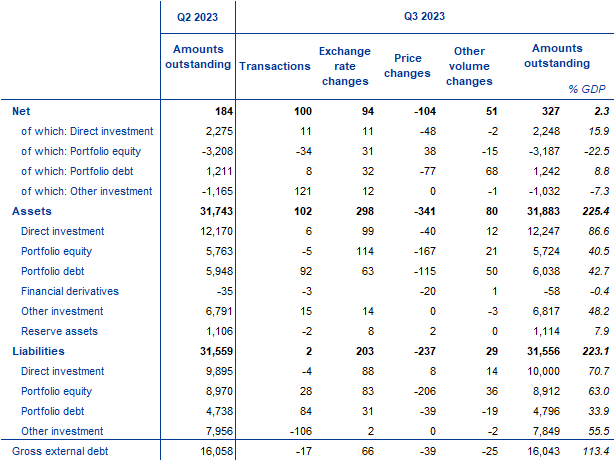
Notes: “Equity” comprises equity and investment fund shares. Net financial derivatives are reported under assets. “Other volume changes” mainly reflect reclassifications and data enhancements. Discrepancies between totals and their components may arise from rounding.
The developments in the euro area’s net international investment position in the third quarter of 2023 were driven mainly by transactions and positive net flows from exchange rate changes and other volume changes which were partly offset by price changes (Table 2 and Chart 3).
At the end of the third quarter of 2023 the gross external debt of the euro area amounted to €16.0 trillion (113% of euro area GDP), down by €15 billion compared with the previous quarter.
Chart 3
Changes in the net international investment position of the euro area
(EUR billions; flows during the period)
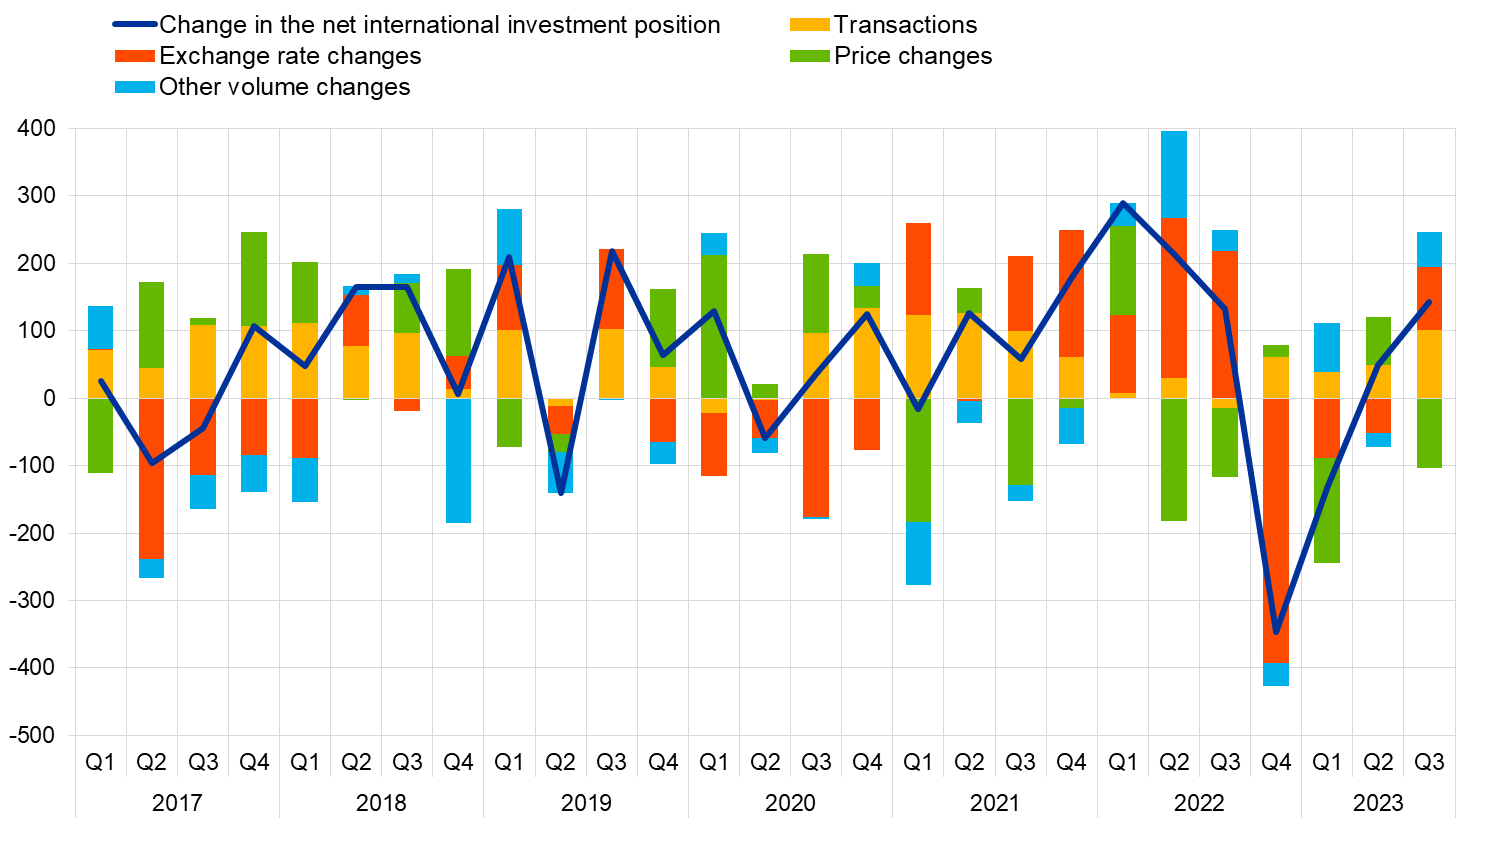
Source: ECB.
Note: “Other volume changes” mainly reflect reclassifications and data enhancements.
Data revisions
This statistical release incorporates revisions to the data for the reference periods between the first quarter of 2020 and the second quarter of 2023. The revisions reflect revised national contributions to the euro area aggregates as a result of the incorporation of newly available information.
Next releases
- Monthly balance of payments: 18 January 2024 (reference data up to November 2023)
- Quarterly balance of payments and international investment position: 9 April 2024 (reference data up to the fourth quarter of 2023)
For queries, please use the Statistical information request form.

