Net interest income of households and firms
Net interest income of households and firms
Prepared by Gabe de Bondt, Georgi Krustev, Michal Slavik, and Mika Tujula
Published as part of the ECB Economic Bulletin, Issue 8/2023.
This box focuses on developments in the net interest income of households and firms amid rising interest rates. After a decade of low interest rates the ECB started a series of policy rate hikes in July 2022. Changes in policy rates affect the interest rates received on interest-bearing assets, such as bank deposits, and those paid on interest-bearing liabilities, such as loans and bonds. These, in turn, affect the interest income received and paid by households and firms, as does the size, remaining maturity and time to repricing of their interest-bearing assets and liabilities. Net interest income, i.e. interest received minus interest paid, captures a direct channel through which ECB policy rate changes are transmitted to savers and borrowers via the interest rates for the assets and liabilities they hold.[1] This is in addition to the incentives provided by the interest rates offered on new loans and savings instruments, as well as other transmission channels affecting households and firms that are beyond the scope of this box.[2]
Households and firms have had negative net interest income at the aggregate euro area level over recent years. Similarly, sectors such as the general government sector and, to a much lesser extent, the rest of the world have also had negative net interest income. This is in stark contrast to financial corporations, which have generated high positive net interest income. Since 2007 interest paid has outweighed interest received by up to 1% of GDP for households in the euro area and up to 2.5% for firms (Chart A). The adjustment of net interest income in the latest ECB interest rate hiking cycle differs across households and firms. Net interest income of euro area firms as a share of GDP has declined by 0.3 percentage points since the end of 2021, while the net interest income of households has increased by 0.1 percentage points. This contrasting development reflects a more gradual repricing of the interest paid by households on their outstanding stock of debt compared to firms, which largely relates to households having a higher share of fixed-rate loans.[3]
Chart A
Euro area interest received, interest paid and net interest income of households and firms
(four-quarter flows in percentage of nominal gross domestic product)
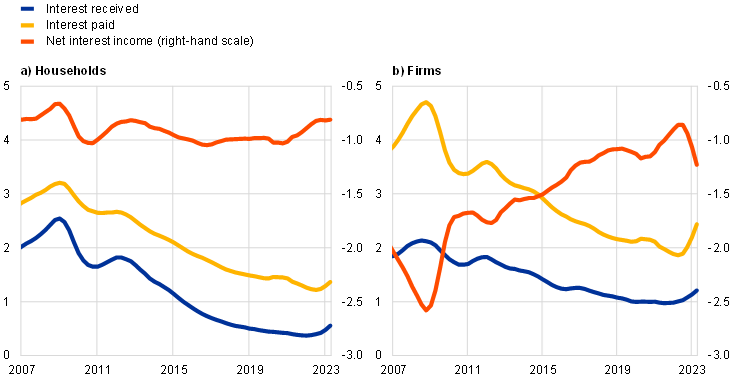
Sources: Eurostat and ECB quarterly sector accounts (QSA) data and authors’ calculations.
Note: The latest observations are for the second quarter of 2023.
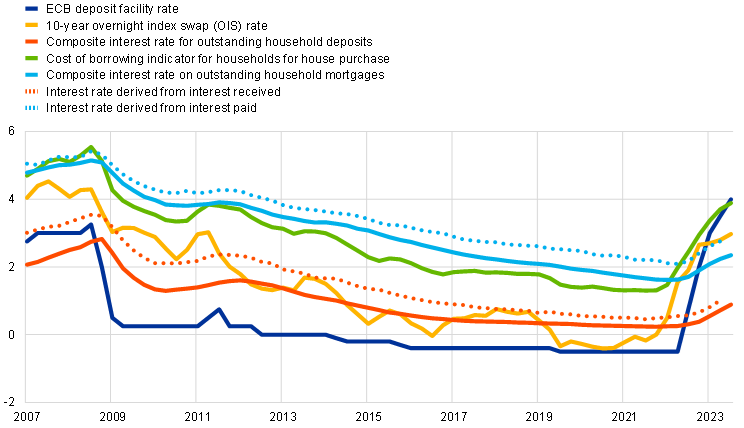
The difference between the interest rates received on assets and those paid on liabilities is an important driver of net income. Despite a positive nominal net asset position, the negative net interest income of households at the aggregate euro area level indicates that the average interest rate paid on outstanding debt is higher than the average interest rate received on outstanding deposits due to the maturity transformation services provided by financial corporations and the associated financial intermediation margins (Chart B). In terms of dynamics, since the end of 2021 euro area household net interest income has benefited from the gradual adjustment in rates for outstanding amounts of mortgages due to their longer durations. This is in spite of the fast increase observed in mortgage rates for new business. Although households are actively rebalancing their asset portfolios towards time deposits and debt securities, the interest received has been dampened by the high share of savings that are held in overnight deposits. These tend to have lower remuneration and are less reactive to policy rate changes. The interest rate derived from interest income received by households follows a similar pattern to the composite interest rate for outstanding household deposits. A comparable picture emerges for the interest rates paid and received by firms, though a much higher interest rate is derived from the interest income received compared with the composite interest rate for outstanding deposits. These deposits only account for around a third of firms’ interest-bearing assets, and the majority relate to higher-yielding intercompany loans.
Chart B
Interest rates for deposits and loans to euro area households and firms
a) Households
(percentages per annum)
b) Firms
(percentages per annum)
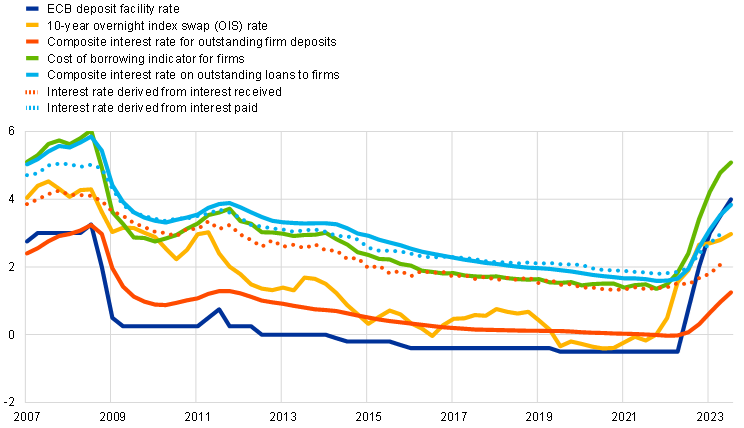
Sources: Eurostat and ECB QSA data, MFI interest rate data, BSI data and authors’ calculations.
Notes: The latest observations are for the second quarter of 2023 for the derived interest rates, and the third quarter of 2023 for the other items. The composite deposit rate for households is a weighted average of the interest rates for overnight deposits, deposits with agreed maturity and deposits redeemable at notice. The composite deposit rate for firms is a weighted average of the interest rates for overnight deposits, deposits with agreed maturity and repurchase agreements, with their corresponding weights.
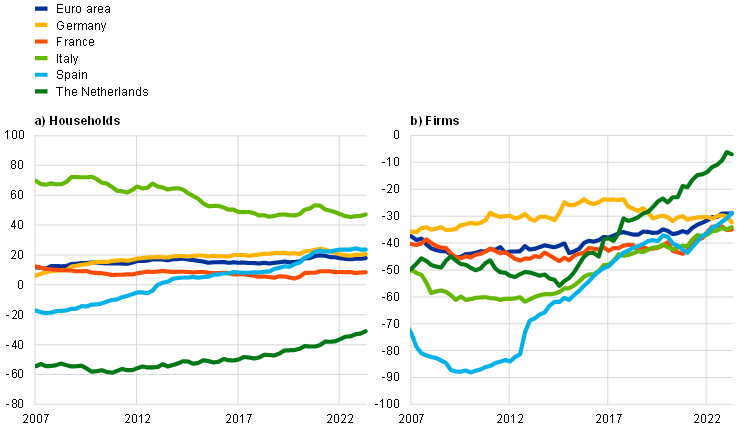
Net interest income at theeuro area level masks striking cross-country differences, which primarily reflect differing net asset positions between sectors. Of the five largest euro area countries, household net interest income is notably more negative in Spain and the Netherlands (Chart C). In 2023 household net interest income was around -10% of GDP in Spain and -2% in the Netherlands, whereas the percentage was close to zero in the other large euro area countries. Italian households are at the other end of the spectrum, with long-standing positive net interest income that has only turned slightly negative in 2020. Looking at recent quarters, household net interest income has been relatively flat in all the largest euro area countries apart from Spain, where it has visibly declined. This decline reflects the comparatively large share of adjustable-rate mortgages in Spain, which allow for a faster repricing of liabilities to higher market rates, and significant holdings of overnight deposits, as well as the country’s slower pass-through of policy rates to deposit rates. Net interest income for firms has fallen in all countries since the rate hiking cycle began in 2022, reflecting a large amount of corporate debt with short maturities or variable rates in aggregate, albeit with significant differences across countries.
Chart C
Net interest income in the largest euro area countries
(four-quarter flows in percentage of nominal gross domestic product)
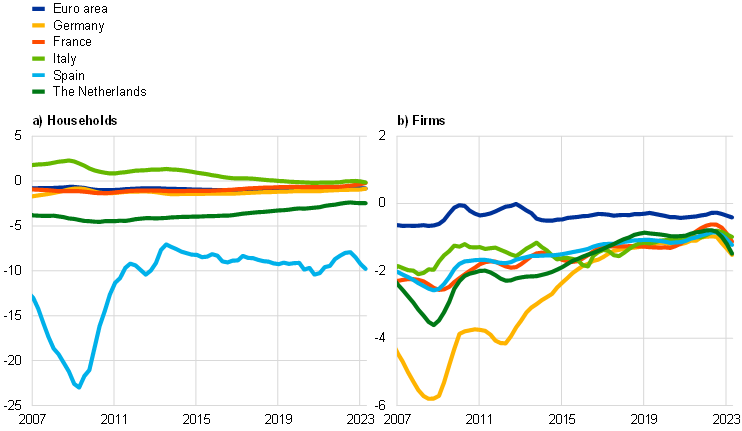
Sources: Eurostat and ECB QSA data and authors’ calculations.
Note: The latest observations are for the second quarter of 2023.
Net interest-bearing assets have also been a major driver of net interest income developments and display striking diversity across countries. For households, interest-bearing assets outweigh liabilities in all the largest euro countries apart from the Netherlands (Chart D).[4] Net interest-bearing assets have been consistently higher in Italy than in the other large euro area countries, reflecting a lower level of debt and higher holdings of interest-bearing assets, particularly debt securities issued by the general government. However, net interest-bearing assets as a percentage of GDP have declined in Italy since the end of 2009. This reflected a drop in the holdings of debt securities, which explains the convergence of the net interest income towards the euro area total. For the Netherlands, the past ubiquity of interest-only mortgages explains why liabilities exceed interest-bearing assets and why net interest income is below that of the euro area as a whole. Net interest-bearing assets have increased in Spain since the global financial crisis, reflecting a decline in indebtedness that, together with the high share of variable rate loans and declining interest rates, has led to an improvement in net interest income. Nevertheless, net interest income remains significantly lower in Spain than in the other large euro area countries. This is because the share of overnight deposits with lower remuneration in the total amount of interest-bearing assets in Spain has increased continuously since 2014 and is currently at a much higher level than in other countries. For firms, interest-bearing liabilities outweigh assets in all the largest euro area countries. Net interest-bearing assets, as a percentage of GDP, have remained relatively unchanged in Germany and France over the last decade, but steadily trended upwards in Spain, Italy and the Netherlands. In Spain and Italy, the improvement in net interest income since 2012 is primarily explained by a decline in indebtedness, together with high share of variable rate debt and lower interest rates.
Chart D
Net interest-bearing assets in the euro area and in the largest euro area countries
(outstanding amounts as a percentage of four-quarter flows of nominal gross domestic product)
Sources: Eurostat, ECB QSA data and authors’ calculations.
Notes: Net interest-bearing assets are an institutional sector’s total interest-bearing assets minus its debt liabilities. Interest-bearing assets include deposit holdings, directly held debt securities and loans granted. In the case of households, debt liabilities include loans received from all institutional sectors. For firms, debt liabilities also include issued debt securities. The latest observations are for the second quarter of 2023.
To summarise, the effect of interest rate increases on the net interest income depends on whether the institutional sector, on a net basis, acts as a lender or borrower. Rising rates negatively affect institutional sectors that need to borrow funds due to higher financing costs; conversely, net savers earn more because they can profit from higher interest rates on their assets. Moreover, changes in the interest rates received and paid on the stock of assets and liabilities occur only gradually, as variable rate instruments are repriced and legacy fixed-rate instruments mature. The net interest income of euro area households has increased by 0.1% of GDP since the end of 2021 and has slightly stimulated private consumption expenditure through the marginal propensity to consume out of interest income. However, its positive effect on consumption has been smaller than the negative effect of higher interest rates transmitted through other channels. In contrast, the net interest income of firms has declined by 0.3% of GDP since the end of 2021, resulting in lower investment due to cash flow sensitivity.
-
The focus of this box is on net interest income before the allocation of financial intermediation services indirectly measured (FISIM), as this more accurately reflects the effective interest rates encountered for loans and deposits. This is unlike the measurement of net interest income in the national accounts, which is recorded after FISIM allocation, meaning interest paid and interest received are computed as if deposits and loans are paid based on a reference rate, or the interbank refinancing rate. FISIM is used in the national accounts to compute the value of intermediation services provided by financial institutions that do not have explicit service charges. For more information, see Chapter 14 of Regulation (EU) No. 549/2013 of the European Parliament and of the Council of 21 May 2013 on the European system of national and regional accounts in the European Union (OJ L 174, 26.6.2013, p. 1), and “Household Income”, Economic Outlook, INSEE, 15 December 2022.
-
For more information on this topic, see the box entitled “Low interest rates and households’ net interest income”, Economic Bulletin, Issue 4, ECB, 2016. For a description of the main monetary policy transmission channels, see Lane, P. R., “The banking channel of monetary policy tightening in the euro area”, remarks at the Panel Discussion on Banking Solvency and Monetary Policy, NBER Summer Institute 2023 Macro, Money and Financial Frictions Workshop, 12 July 2023.
-
For the share of fixed-rate loans for households and firms in the euro area, see Lane, P. R., op. cit.
-
In addition to deposits and debt securities, households can also save by purchasing shares, investment fund shares, life insurance, pension products and real estate. Net asset positions for households, namely the difference between total assets held and total debt liabilities, stood between 420% and 607% of GDP in the five largest euro area member countries in the second quarter of 2023.

