Monetary dynamics during the tightening cycle - Prepared by Ramón Adalid, Max Lampe and Silvia Scopel
Prepared by Ramón Adalid, Max Lampe and Silvia Scopel
The policy rate hiking cycle that started in mid-2022 has led banks to increase the deposit rates they offer.So far, the ECB has raised its three key interest rates by 450 basis points over the tightening cycle. Compared with the levels seen at the end of May 2022, shortly before the intention to hike interest rates was announced at the June press conference, interest rates on newly agreed time deposits have risen by 372 basis points and those on overnight deposits by 50 basis points.
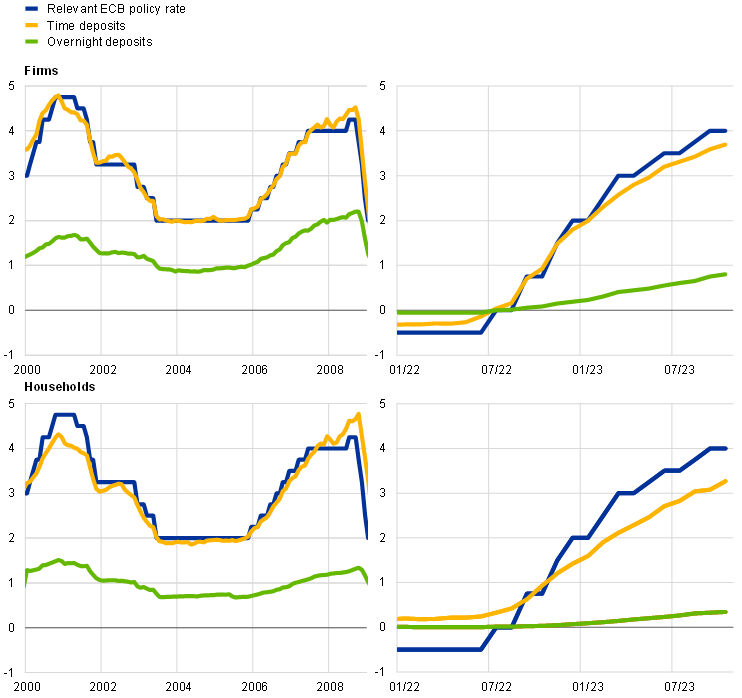
Nevertheless, deposit rates remain somewhat below historical norms when compared with policy rates, especially for households and mainly for their overnight deposits. When interest rates are positive, the remuneration on time deposits tends to closely follow the policy rate.[1] In October 2023 euro area firms and households were on average offered an annual interest rate of 3.70% and 3.27% respectively, for newly agreed time deposits with a maturity of up to two years. This implies spreads relative to the policy rate of -30 and -73 basis points respectively. In October the spread for firms’ time deposits was within the historical range while that for households’ time deposits was somewhat wider but not unprecedented, being broadly similar to that observed in early 2001, at the height of the 2000-01 tightening cycle. In contrast to time deposits, the remuneration on overnight deposits typically remains well below the policy rate when interest rates are well above zero, reflecting the payment, liquidity and convenience services offered by sight deposits (Chart A, panel a).[2] The associated remuneration also moves slowly, meaning that the size of the resulting spread relative to the policy rate tends to widen during tightening cycles. This widening is consistent with the notion that high switching costs give banks market power, especially in the sight deposit market.[3] In October 2023 these deposits offered a negative spread considerably wider than in the 2007-08 period, when rates stabilised at the peak of hiking cycle but less so compared with the plateau reached in the 2000 cycle. However, it should be taken into account that deposit remuneration in the 2007-08 period might have been partly supported by banks’ liquidity needs as the global financial crisis started to unfold. Symmetrically, the dynamics in the current cycle appear to be also partly affected by the low funding needs of banks in the context of weak lending and less competition in some segments of the deposits market.[4]
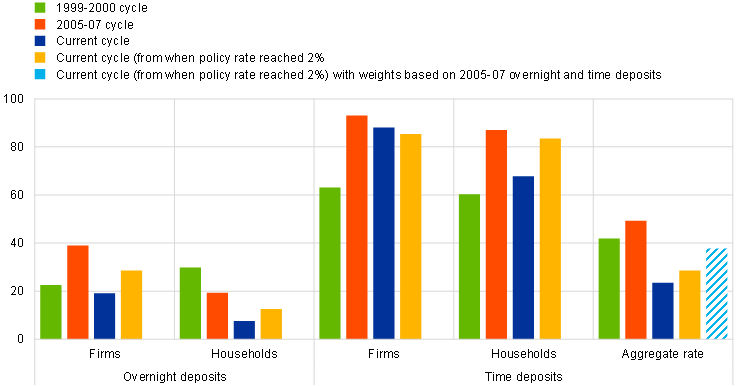
Accumulated changes in deposit rates have been relatively weak, partly because deposit rates were above the policy rate during the time of negative interest rates preceding the current cycle, but also because of a genuine weaker transmission to overnight deposit rates for households. The ratio of the increase in deposit rates to the increase in policy rates is a measure widely used to compare the strength of the interest rate pass-through to deposit rates across tightening cycles. This ratio is usually referred to as the deposit beta. However, this measure is sensitive to the starting point, especially if the spread between the deposit rate and the policy rate at that point differs from the historical norm. This was the case at the beginning of the current tightening cycle as, in mid-2022, the spreads between deposit rates and policy rates were negative (Chart A, panel a, right graph). These inverted deposit spreads reflect the fact that banks were reluctant to pass on the negative interest rates to their retail depositors because of legal barriers and litigation risks or concerns about deposit withdrawals.[5] The end of the period of negative and very low interest rates allowed the spreads between the policy rate and the deposit rates to return towards their historical patterns, marking a period when policy rate hikes were matched by only minor increases in deposit rates. For this reason, it is important to exclude the period of low policy rates when using deposit betas to compare the strength of the deposit rate pass-through against past episodes. It would be possible, for example, to exclude the period when the policy rate was below 2%, the level at the start of the previous cycle. If this is done, deposit betas increase for all overnight deposits, as well as for those time deposits held by households. The fact that firms and households currently hold a higher share of overnight deposits than they used to is another factor that affects aggregate deposit betas, i.e. those that weight deposit rate increases across various deposit types based on their outstanding amounts (Chart B, panel b). Using the deposit shares from the 2005-07 tightening cycle (instead of the current shares) to blend the remuneration on overnight deposits and time deposits causes the resulting deposit beta to approach that of the previous hiking cycles, although it still remains somewhat lower (Chart A, panel b). This is mostly due to the genuinely weaker transmission of policy rate hikes to overnight household deposits.
Chart A
Interest rate pass-through in the euro area
a) Interest rate levels
(percentages per annum)
b) Deposit betas
(percentages)
Source: ECB.
Notes: Time deposits are the rates on newly agreed contracts with a maturity of up to two years. Deposit betas are defined as the ratio of the increase in deposit rates against the increase in policy rates. The latest observations are for October 2023.
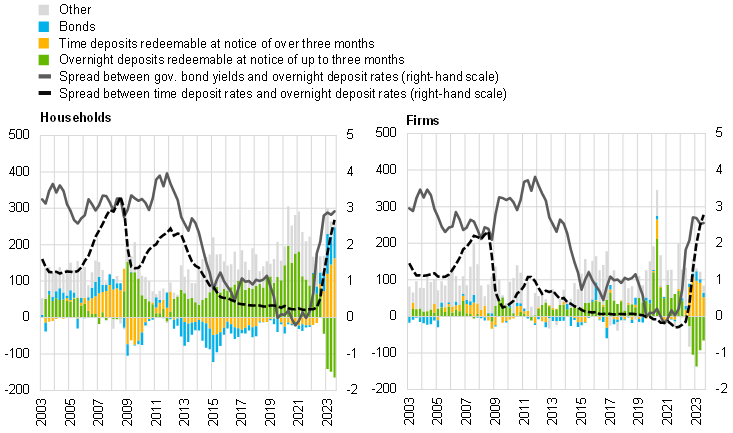
The increased remuneration of time deposits and bonds after a long period of low or negative interest rates has incentivised shifts to these instruments from overnight deposits and other low-remuneration deposits. During the period of low interest rates, the opportunity cost of holding overnight deposits was very low, causing households and firms to accumulate virtually all of their new money balances in overnight deposits (Chart B, panel a). The current monetary policy tightening, and its transmission to deposit rates and yields on other financial assets, has increased the opportunity cost of holding overnight deposits to levels similar to those seen in previous hiking cycles. This has led firms and households to move a significant portion of their unusually large stock of overnight deposits to time deposits and bonds. That stock has contracted compared with mid-2022 but remains high by historical standards. This is all the more evident for households than for firms (Chart B, panel b),[6] which could explain the moderation in deposit shifts by firms observed over the past two quarters.
Chart B
Portfolio rebalancing
a) Financial investment by firms and households
(left-hand scale: quarterly flows, EUR billions; right-hand scale: percentage points)
b) Overnight deposits
(percentage share of total deposit holdings)
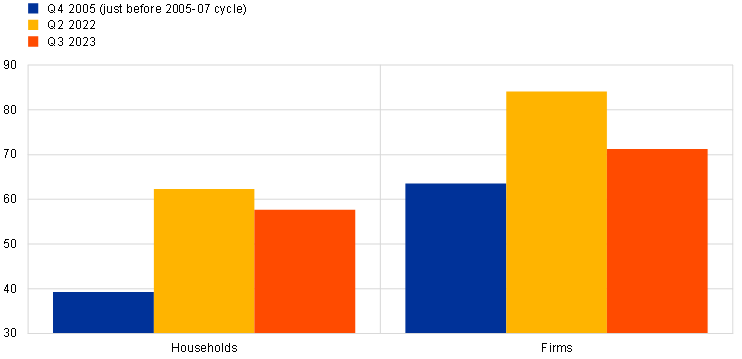
Source: ECB.
In general, in addition to affecting portfolio decisions by households and firms, changes in monetary policy affect money creation in a number of ways. First, via credit creation as, when banks provide credit, this is immediately reflected in an increase in the deposit balances of the borrowers, which they can then use for their payments and other transactions.[7] Second, in a similar fashion, broad money balances increase when the central bank acquires assets from euro area residents other than banks, and also when non-residents acquire goods, services and financial assets from euro area residents other than banks.[8] Finally, central bank credit to banks can also lead to money creation to the extent that it substitutes for bond funding, thereby freeing up funds that depositors can keep in their accounts.
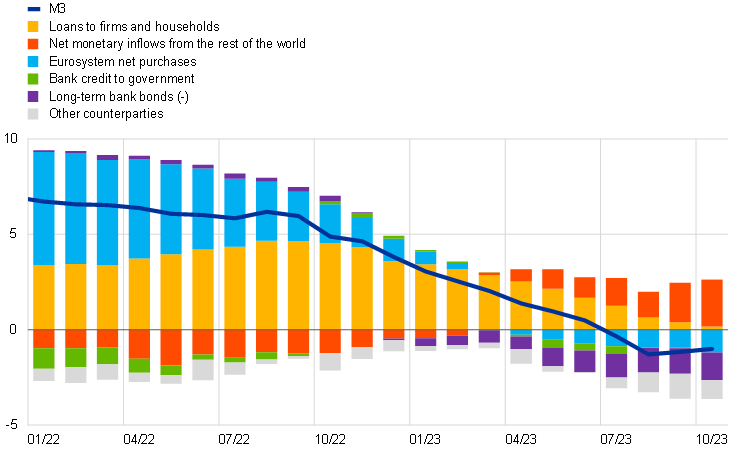
The current monetary policy tightening has weakened broader money creation, pushing it into negative territory at a historically low level. Since the current tightening cycle started, higher interest rates have brought down both loan demand and loan supply considerably. This has drastically reduced credit volumes, which is a typical source of money creation. Furthermore, the contraction of the Eurosystem balance sheet has reinforced the decline in credit supply and has had a direct dampening effect on M3 via two channels: (i) TLTRO repayments, which incentivise banks to issue long-term bonds, thus reducing money balances as depositors acquire these bonds; and (ii) the progressive redemptions of the asset purchase programme portfolio, which remove money from circulation.[9] As a result, the contribution to annual M3 from loans to firms and households fell from 4 percentage points in mid-2022 to around zero in October 2023, while bank bond issuance is currently sapping around 1.5 percentage points from the annual M3 stock. The direct contribution from Eurosystem purchases turned negative, from close to 6 percentage points in early 2022 to -1 percentage point in October 2023. This has, however, largely been offset by purchases of government bonds by foreign investors, although household purchases of bonds are currently weighing somewhat on monetary dynamics. The recovery in the current and capital accounts surplus, which also reflects the weakening of domestic demand for foreign goods, has also further supported net monetary inflows from abroad since late 2022 (Chart C, panel a).
Chart C
Monetary aggregates
a) Sources of money creation
(annual percentage changes; contributions to annual percentage changes)
b) Monetary aggregates
(annual percentage changes)
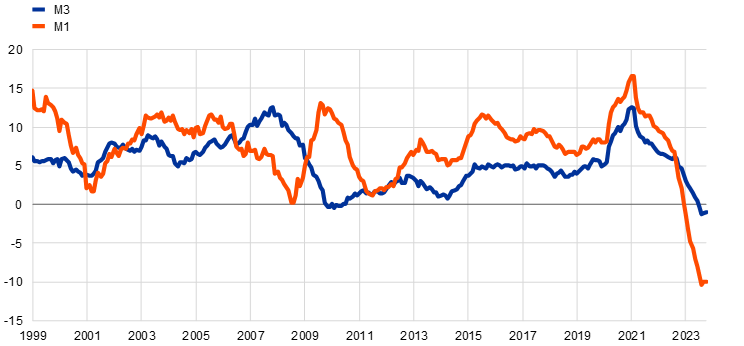
Source: ECB.
Notes: MFI stands for monetary financial institution. The latest observations are for October 2023.
Deposit shifts and the contraction of broad money have resulted in negative growth of unprecedented size in the narrow monetary aggregate M1. As overnight deposits are the main component of M1, shifts away from them have resulted in an unprecedented contraction of this aggregate (by roughly 10% since the summer; Chart C, panel b). Given that M1 growth has historically been a good predictor of real GDP growth, this has raised concerns about a further slowdown in economic activity.[10] In part, this connection operates via consumption, savings and investment decisions, because M1 is a relevant indicator of the degree of liquidity in the economy. In the current situation, however, the ongoing shift away from overnight deposits and the previous strong growth of M1 since 2015 – which was largely linked to the combination of net asset purchases and low interest rates – may be blurring the usual signal. In other words, a reduction in M1 resulting from a portfolio shift away from overnight deposits should, in principle, have a more contained impact on agents’ spending capacity. It should therefore have a smaller negative impact on GDP than that of a typical decline in M1, particularly given that the stock of overnight deposits remains relatively high by historical standards. However, this does not mean that M1 should be dismissed altogether, especially if accompanied by tensions in financial markets and heightened demand for liquidity.
-
The policy rate is the interest rate that a central bank uses to signal its monetary policy stance. The main refinancing rate was used as the reference rate to calculate the spreads relative to deposit rates in the first decade of the euro as, in an environment of very low levels of excess liquidity, the rate on the main refinancing operations was the main reference for market interest rates. For most of the past decade, by contrast, the interest rate on the deposit facility has become the main anchor for market interest rates in the prevailing environment of ample excess liquidity. Accordingly, that rate has been used to calculate the spreads relative to deposit rates for that period.
-
See Drechsler, I., Savov, A. and Schnabl, P., “The deposits channel of monetary policy”, The Quarterly Journal of Economics, Vol. 132, No 4, 2017, pp. 1819-1876.
-
See Polo, A., “Imperfect pass-through to deposit rates and monetary policy transmission”, Staff Working Paper, No 933, Bank of England, 2021.
-
See Mayordomo, S. and Roibás, I., “The pass-through of market interest rates to bank interest rates”, Documentos Ocasionales, No 2312, Banco de Espana, 2023.
-
See the article entitled “Negative rates and the transmission of monetary policy”, Economic Bulletin, Issue 3, ECB, 2020.
-
The time period Q4 2005 is taken as the relevant reference for comparison because it is the start of the 2005 tightening cycle. Using the average over a longer period (such as the one used in Chart A, panel a, right graph) as a benchmark would not change the conclusion that the weight of overnight deposits is still substantially higher than in the past, especially for the household sector.
-
This does not imply that banks can create unlimited deposits. First, the deposits created may well end up at other banks. Second, in order to grant credit, banks need among other things to take into account their broader funding and solvency position and the risk inherent in their exposures and comply with regulatory constraints.
-
M3 predominantly comprises short-term and liquid liabilities issued by monetary financial institutions and held by the money holding sector.
-
See Lane, P., “The banking channel of monetary policy tightening in the euro area”, remarks at the Panel Discussion on Banking Solvency and Monetary Policy, NBER Summer Institute 2023 Macro, Money and Financial Frictions Workshop, 12 July 2023.
-
See the box entitled “The predictive power of real M1 for real economic activity in the euro area”, Economic Bulletin, Issue 3, ECB, 2019.

