Banks’ capital distributions and implications for monetary policy
Banks’ capital distributions and implications for monetary policy
Prepared by Cyril Couaillier, Maria Dimou and Conor Parle
Banks distribute capital to equity investors by either paying dividends or buying back shares, with ambiguous implications for the transmission of monetary policy via banks. On one hand, capital distributions can be beneficial for monetary transmission in the long run by making banks attractive to investors. First, a capital distribution signals managers’ confidence in their bank’s expected stream of profits or an assessment that the bank’s current stock price is undervalued. Second, dividend distributions enable investors to increase control of the cash generated by the bank and benefit from the accompanying payouts, rather than keeping it fully at the disposal of management. Through these two channels, capital distribution can signal the soundness of a bank to equity investors. This feeds into a lower cost of equity for the bank, making it easier for it to tap financial markets. Ultimately, a lower cost of equity can support banks’ financial health, preserving their ability to smoothly transmit monetary policy. On the other hand, capital distributions lower banks’ capital ratios, all other factors being equal. These distributions could be a manifestation of past or future economic weakness, as banks may distribute capital that they did not have the opportunity, and do not anticipate the need, to deploy to satisfy loan demand for investments. Distributions would then be consistent with the transmission of monetary policy tightening. Moreover, the reduced intermediation capacity would also feed into the bank-based transmission of the tightening of monetary policy, as lower capital buffers would help to tighten credit conditions. However, in particular during times of uncertainty, excessive or ill-timed payouts can amplify stress and hamper the smooth transmission of monetary policy in a situation where the financial system has been hit by a shock.[1] In some circumstances, this may make the financial system more prone to the risk of financial instability. Banks should therefore follow prudent payout policies.
Since the end of the most acute phase of the pandemic and the expiry of ECB Banking Supervision’s recommendation to restrict payouts, banks in the euro area have distributed capital at a rapid pace, especially via significant buyback programmes (Chart A), catching up on forgone distributions in previous years. A new bank-level database of dividends and buybacks of euro area banks, sourced from annual reports, sheds light on the dynamics behind the distribution of equity. These data allow the expected payouts for the financial year 2022 (i.e. planned to be paid out in 2023) to be examined and payout dynamics to be assessed at both a micro and a macro level. ECB Banking Supervision’s recommendation in March 2020 to halt capital payouts during the pandemic led to a sharp fall in capital distribution in that year, as many banks cancelled payments they had planned to make out of profits from 2019 (Chart A). In December 2020 this recommendation was changed to ask banks to refrain from or limit payouts. Since the expiry of the latter recommendation in September 2021, euro area banks have resumed their payouts, with increased volumes compared with the pre-pandemic years but still short of the distributions that had been planned for 2020 and 2021. While dividends are slightly above their pre-pandemic level, the bulk of the increase in capital distributions stems from share buybacks. These account for 33% of payouts based on 2021 profits and 29% of planned payouts on 2022 profits (Chart A, yellow bars), whereas between 2017 and 2019 buybacks were virtually non-existent.
Chart A
Distributions of dividends and buybacks as a percentage of total assets
(percentages of total assets)
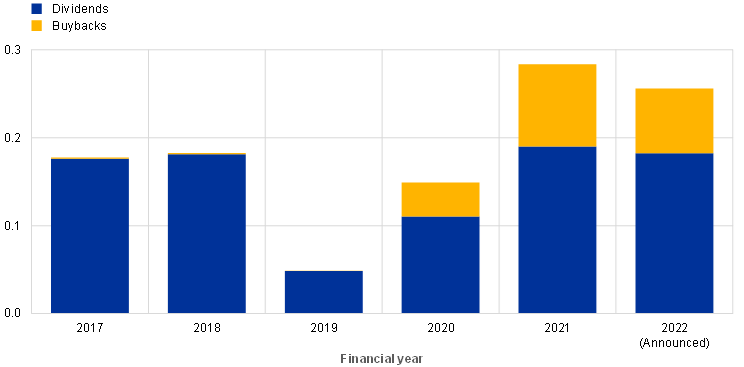
Sources: Banks’ financial accounts and ECB calculations.
Notes: The chart shows the aggregate annual value of dividend payments and share buybacks for cancellation purposes for a sample of 57 euro area banks scaled by the sum of the averages of total assets across each year for each bank. Where data for a given financial year are unavailable, total assets for the next financial year are used. Values are taken from annual reports for each bank and represent the sum of both interim payments made before the end of the reference financial year and final payments made after the end of the year, with both types of payment being related to profits during the reference financial year. The latest observations are for the distribution of 2022 profits (to be paid out in 2023).
Chart B
Bank-level realised payout ratios for 2022 profits and target minimum payout ratios
(percentages)
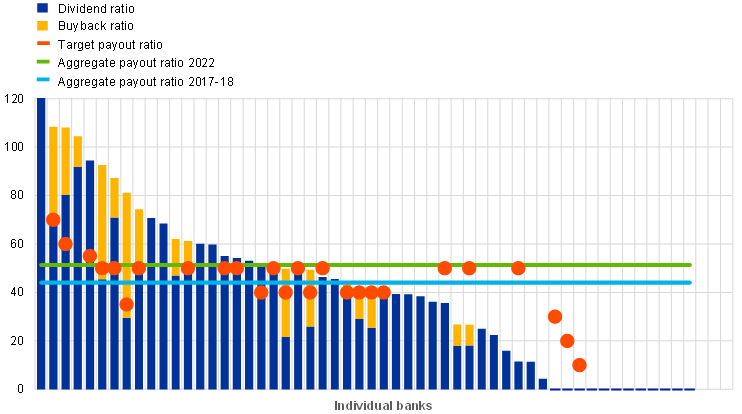
Sources: Banks’ financial accounts, ECB supervisory reporting and ECB calculations.
Notes: The chart plots the total buybacks and dividends for profits attributable to the 2022 financial year as a proportion of net profit for individual banks in that year. The far left bar represents a total ratio of 350% for a bank that made an extraordinary payment in 2023 related to the 2022 financial year. The dots show target minimum payout ratios for a subsample of banks for which such targets are published. The green and light blue solid lines show the aggregate payout ratios (defined as the sum of total payouts divided by the sum of net profits for all banks in the sample) for 2022 and 2017-18 respectively. The period 2019-21 is not included since it was at least partly affected by the pandemic. The small bars on the right-hand side equal to zero correspond to banks with no planned dividends or buybacks for financial year 2022 at the time of the analysis. All ratios relate to the distribution of 2022 profits (to be paid out in 2023).
Payout volumes vary substantially across banks in terms of both the total payout and the importance of extraordinary buybacks (Chart B), while banks’ stated plans suggest a further increase in dividends is likely. On aggregate, a sample of listed euro area banks have paid out or intend to pay out approximately 50% of their overall 2022 profits in dividends and buybacks (solid green line in Chart B), considerably above the aggregate payout ratio of 44% for the financial years 2017 and 2018 (the last two years unaffected by the pandemic, solid light blue line in Chart B) but broadly in line with a catch-up vis-a-vis forgone distributions.[2] However, aggregate volumes mask considerable differences across banks, particularly regarding share buybacks (yellow bars in Chart B). The stated reasons for buybacks vary, with some being marked as a structural component, but most being extraordinary.[3] This is suggested, for example, by the fact that most of the differences between actual payout ratios and payout ratio targets taken from banks’ public reports correspond to share buybacks. Most banks target payout ratios between 40% and 60%, while others have much lower ratios if they are rebuilding capital after stress periods such as the global financial crisis and sovereign debt crisis (orange dots in Chart B). Moreover, despite the rise in dividends compared with the pre-pandemic period, many banks are still below their targets or do not distribute dividends at all. It is possible that banks with more limited capital available, or facing other regulatory constraints, will raise dividends as their situation normalises and peer pressure increases, resulting in a further increase in aggregate dividends in the future.
Banks tend to distribute more capital when they are more profitable, have higher asset quality (measured by non-performing loan ratios) and more liquidity, and also tend to smooth distributions over time, as captured by lagged distribution (Chart C). These correlations are confirmed by a multi-year econometric analysis which indicates that banks’ payout yields (i.e. payouts as a percentage of bank equity) are driven by their own lags and by banks’ return on equity (ROE) and non-performing loan (NPL) ratios (Chart D), in line with the literature.[4] According to the estimates, each additional percentage point of ROE for the banking sector as a whole translates into €2 billion of higher payouts. The increase in bank net interest margins against the backdrop of the monetary policy tightening since mid-2022 is likely to have contributed positively to banks’ capital distributions so far. At the same time, the impact of the tightening is likely to compress profitability over time as loan growth weakens, credit risk increases and deposit rates rise, limiting the space for further payouts. Moreover, the analysis also suggests that banks with better liquidity positions, as captured by the liquidity coverage ratio (LCR), also make higher payouts. Overall, it seems that the banks distributing the most dividends over recent years were those in the soundest position to do so.[5]
Chart C
Payouts on 2022 profits versus their own lag, ROE, the NPL ratio and the LCR
(x-axis: percentages of equity (first and second panels), percentages of loans (third panel) and liquidity coverage ratio (fourth panel); y-axis: percentages of equity)
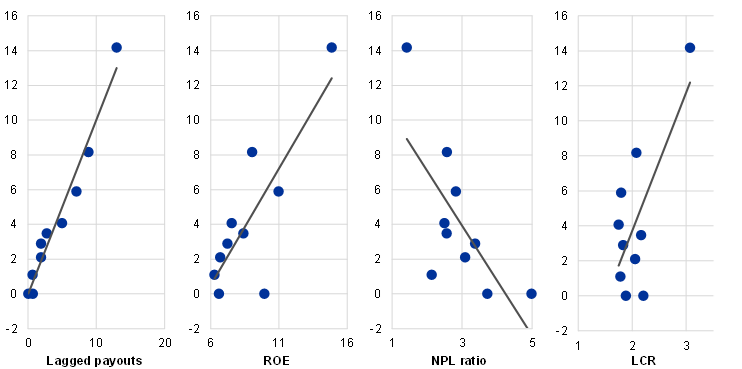
Sources: Banks’ financial accounts, ECB supervisory reporting and ECB calculations.
Notes: The chart plots deciles of the distribution of banks’ annual payout yields (dividends and share buybacks divided by the book value of equity) on 2022 profits against their own lag (first panel) and against lagged values of ROE (second panel), the NPL ratio (third panel), and the LCR (fourth panel). ROE, the LCR and the NPL ratio are lagged by one year.
Chart D
Regression coefficients explaining payout yields for profits from 2016 to 2022
(regression coefficients showing the impact of 1 percentage point of lagged payout yield, ROE, LCR, growth of total assets, CET1 ratio and NPL ratio, and 1 unit of the log of total assets, on payout yield in percentage points)
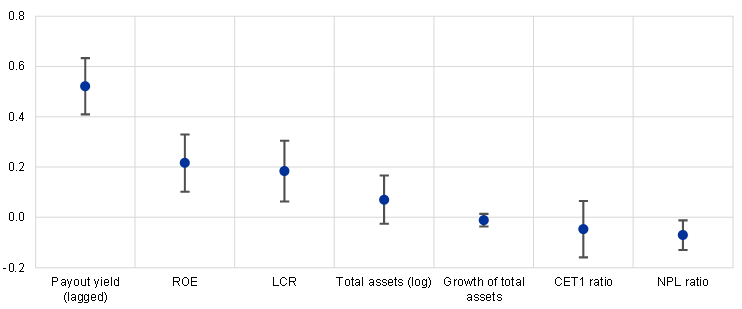
Sources: Banks’ financial accounts, ECB supervisory reporting and ECB calculations.
Notes: The chart shows coefficients of the regression of banks’ annual payout yields (dividends and share buybacks divided by the book value of equity) on their own lag and lagged values of ROE, the LCR, bank size (the log of total assets), the annual growth rate of total assets, the Common Equity Tier 1 (CET1) capital ratio and the NPL ratio. Regressions also include year fixed effects. Explanatory variables are lagged by one year. Variables are scaled (mean zero and standard error 1). Error bars show 90% confidence intervals. Standard errors are clustered at bank level. The sample period covers the financial years 2016 to 2022, excluding 2019 owing to the ECB Banking Supervision recommendation on dividends and share buybacks. The latest observations are for the distribution of 2022 profits (to be paid out in 2023). Results relate to a sample of 57 euro area banks.
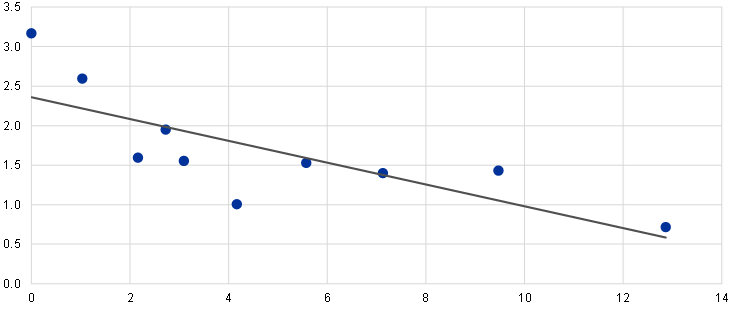
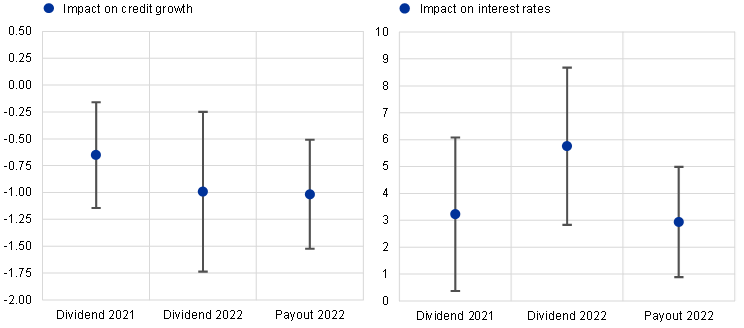
While recent payouts have had a positive signalling effect on financial markets, higher payout commitments have been associated with lower bank credit supply and higher lending rates, therefore possibly contributing to the transmission of the monetary policy tightening impulse so far. Banks that announced larger payout yields based on 2022 profits experienced a lower increase in the cost of equity during the financial market turmoil episode of March 2023 (Chart E). This could be due to the fact that the larger payouts were made by banks with better financial results, but also to some extent to a signalling effect. This effect would be consistent with the findings of other recent work and suggests that the larger payouts announced in recent years could support banks’ intermediation capacity in times of stress.[6] At the same time, there is some tentative evidence of a negative relationship between pre-announced payouts and credit supply since the start of the normalisation of monetary policy. On the basis of granular data from the euro area register of corporate credit (AnaCredit), controlling for loan demand and other confounding factors, dividends on 2021 profits (paid in 2022) appear negatively linked to credit growth and positively linked to bank lending rates in 2022, suggesting lower credit supply over 2022 for banks with higher dividend ratios (see Chart F). By the same token, announced payouts for the financial year 2022 also show a negative link to banks’ 2022 credit supply, suggesting that banks planned their distribution of capital on the basis of preliminary earnings for the year to date and projections of end-of-year profits, and calibrated their lending and more generally their asset-liability management decisions over the course of 2022 taking into account their plans to distribute dividends the following year based on the proceeds from 2022.[7] According to the estimates, the fact that payouts on 2022 profits were around 1 percentage point of payout yield higher than pre-pandemic standards would be associated with a decrease of around 1% in loan volumes, although this correlation could also capture factors related to the overall slowdown in loan growth in the context of monetary policy tightening. The financial year 2022 coincided with the first phase of the tightening cycle, which may have encouraged banks to restrict credit supply in order to distribute capital when it was viable to do so from a profitability perspective. It is therefore important to monitor payouts, against the backdrop of the interplay between capital distributions and the transmission mechanism of monetary policy in coming years.
Chart E
Change in banks’ cost of equity between February and March 2023 and payout yields for 2022 profits
(x-axis: payout yield (percentage points); y-axis: change in the cost of equity (percentages))
Sources: Banks’ financial accounts, Bloomberg, Refinitiv and ECB calculations
Notes: The chart shows deciles of the distribution of banks’ annual payout yields (dividends and share buybacks divided by the book value of equity) for 2022 profits on the x-axis against the change in banks’ cost of equity between February and March 2023 on the y-axis. Cost of equity is an average across ten model-based estimates (as available at the bank level) from Altavilla, C. et al., “Measuring the cost of equity of euro area banks”, Occasional Paper Series, No 254, ECB, January 2021. The solid line shows the line of best fit for the scatter relationship.
Chart F
Impact of payouts from 2021 and 2022 profits on credit growth and interest rates in 2022
(regression coefficients showing the impact of 1 percentage point of dividend or payout yield on credit growth in percentage points and interest rates in basis points)
Sources: Banks’ financial accounts, ECB supervisory reporting and ECB calculations.
Notes: The chart shows coefficients of the regression of credit growth and the change in interest rates at bank level in 2022 on banks’ annual dividend yields (dividends divided by the book value of equity) for 2021 and 2022 profits, as well as the payout yield (dividends and share buybacks divided by the book value of equity) for 2022 profits. Control variables are ROE, the LCR, CET1 headroom above capital requirements, the annual growth rate of total assets, bank size (the log of total assets), the NPL ratio and firm fixed effects. Explanatory variables are lagged by one year. Error bars show 90% confidence intervals. The latest observations are for the distribution of 2022 profits (to be paid out in 2023).
-
For instance, share buybacks could be the result of chief executive officers’ remuneration being tied to the share price. A capital distribution not driven by fundamentals could deplete bank intermediation capacity.
-
The payout ratio for 2019 profits was low following the ECB’s recommendation, and was followed by a considerably larger ratio for 2020 profits as payouts to some extent resumed. The payout ratio for 2019 and 2020 combined was broadly in line with the pre-pandemic figures, suggesting some degree of catch-up.
-
The annual reports of some banks link exceptional buybacks to the sale of subsidiaries. Other banks state the direct aim as being to reduce excess capital in order to maintain an efficient capital structure, or describe buybacks as a part of normal payout policies.
-
See, among others, Belloni, M., Grodzicki, M. and Jarmuzek, M., “Why European banks adjust their dividend payouts?”, Working Paper Series, No 2765, ECB, January 2023; Theis, J. and Dutta, A.S., “Explanatory factors of bank dividend policy: revisited”, Managerial Finance, Vol. 35, Issue 6, 2009; and Dickens, R.N., Casey, K.M. and Newman, J.A., “Bank Dividend Policy: Explanatory Factors”, Quarterly Journal of Business and Economics, Vol. 41, No 1/2, 2002, pp. 3-12.
-
Moreover, further calculations show that the relationship between payouts and the capital available also stems from the fact that, for the sample of banks announcing their target capital ratio to investors, banks with more excess capital pay out more.
-
See the box entitled, “Dividend payouts and share buybacks of global banks”, Financial Stability Review, ECB, May 2020.
-
This is in line with the tendency of banks, as mentioned above, to smooth their dividends over time. Some announce multi-year target payouts, meaning that they enter a new year knowing the dividend aimed at for the year, even considering the uncertainty surrounding end-of-year results. Regressing the credit supply for 2022 on the dividends and payouts on 2022 profits may give rise to reverse causality. However, the bias would be conservative, as higher profits due to higher loans should result in higher dividends. As such, the coefficients thus estimated are likely a lower bound. This conservative bias would be accentuated since profits in 2021 are more likely to have been affected by recovery of payouts following the pandemic, which should further bias the coefficient towards zero in that specification.

