The development of the wage share in the euro area since the start of the pandemic
The development of the wage share in the euro area since the start of the pandemic
Prepared by Katalin Bodnár and Matthias Mohr
Published as part of the ECB Economic Bulletin, Issue 4/2023.
Recent developments in economic activity and the surge in inflation have raised questions about income distribution between the factors of production, namely labour and capital. The wage share (or labour share) is a measure that can capture some of these distributional aspects. It indicates the share of nominal domestic income allocated to labour. In this box it is calculated as total compensation of employees, corrected for the share of self-employed, divided by gross nominal value added.[1] The wage share is intimately interlinked with profit margins.[2] Its development reflects both long-term structural drivers, such as technological changes, globalisation, sectoral reallocation and institutional characteristics (including changes in labour and product market regulation and (minimum) wage-setting frameworks), and more medium-term business cycle drivers, such as labour market tightness and workers’ bargaining power.[3] The wage share can be an important indicator of inflationary pressures through second-round effects on prices.
The wage share in the euro area has decreased since the start of Russia’s war of aggression in Ukraine, following some volatility during the coronavirus (COVID-19) pandemic (Chart A). The wage share stood slightly above 62% at the end of 2019, close to its long-term average. Following the start of the pandemic, it rose strongly to above 65% in the second quarter of 2020. This reflected the decoupling of value added growth and compensation growth owing to the widespread use of job retention schemes. During the pandemic restrictions, output fell and employees worked fewer hours than normal. However, under the job retention schemes they maintained their employment relationships and were partially compensated by governments or employers for the loss of labour income. A significant part of these payments was recorded as wage income in national accounts.[4] Consequently, total compensation of employees declined by less than gross value added. By the beginning of 2022, job retention schemes had largely faded out as economic activity picked up and the wage share had fallen to close to its pre-pandemic level. It then continued to decline until the end of 2022 and was just above 61% in the last quarter of 2022. It edged up slightly in the first quarter of 2023 but was still below its long-term average and about 0.9 percentage points below the level seen in the fourth quarter of 2019.
Chart A
The wage share and unemployment rate in the euro area
(left-hand scale: percentages of gross nominal value added; right-hand scale: percentages of the labour force)
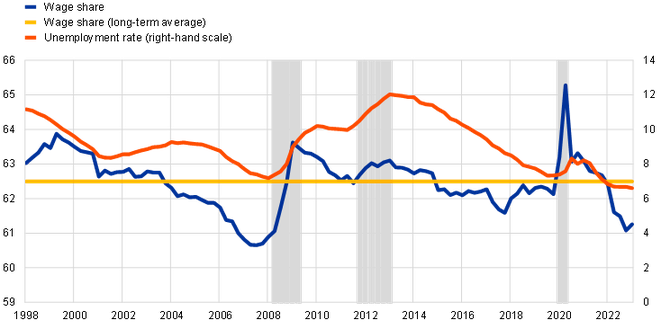
Sources: Eurostat, Euro Area Business Cycle Network (EABCN) and ECB staff calculations.
Notes: The latest observations are for the first quarter of 2023. The long-term average wage share calculated over the period 1998-2023 is 62.4%, the same as the long-term average calculated up to the end of 2019. The shaded areas denote recession episodes dated by the EABCN. The technical recession at the turn of the year is not indicated on the chart, in line with the assessment of the CEPR-EABCN Euro Area Business Cycle Dating Committee on 27 March 2023.
As a broad stylised fact, the wage share follows a countercyclical pattern: it rises at the start of recessions and falls when the recovery starts. This is illustrated in Chart A, in which the unemployment rate (which is also countercyclical) can be seen as a proxy of the business cycle. The chart also shows euro area recessions. The countercyclicality of the wage share is due to the different lags in the responses of profits and wages to economic shocks. At the start of recessions, profits typically contribute most to the decline in income, and thus the wage share increases. When the recovery sets in, profits rebound strongly, leading to a decline in the wage share.[5] Indeed, during the financial crisis of 2008 and the euro area crisis 2010-12, the wage share started at a low point in an overheated economy and then increased strongly in the two recessionary phases of the pre-pandemic period, reflecting falling profits and labour hoarding, before moderating again in the recovery. It also increased at the start of the COVID-19 crisis and the subsequent surge in energy prices, but those episodes were of a different nature: while the primary shocks during the financial crisis were mostly on the demand side, supressing profits, now the economy was hit by a series of supply side shocks. Even though the labour market is tighter and unemployment lower now than before and during the financial crisis (which might be expected to strengthen workers’ bargaining power), the current environment has turned out to be more favourable for increases in profit margins.
The easing of the wage share since early 2022 has been most substantial in industry and construction, while it increased in less contact-intensive private services and public services. Notwithstanding the volatility due to the pandemic, the wage share in the latter sectors increased to a level even higher than would be suggested by their pre-pandemic upward trends (Chart B).[6] In both sectors, this probably reflects recent strong wage growth. Less contact-intensive market sectors provide services primarily to other businesses, including industry. The rise in the wage share in these sectors (both before and after the pandemic) may be connected in part to the declining wage share in the industry sector and reflect the process of outsourcing particularly highly remunerated professional services jobs (such as accounting and legal services) to more specialised service companies. Since the pandemic, the acceleration of digitalisation, requiring a larger share of more highly skilled and better paid employees could have further accelerated these developments.[7] More contact-intensive services – primarily trade, transport and accommodation – saw falls in their wage shares in early 2022, but those falls have recently been reversed, while in industry and construction there is a clearer persistent downward movement. Some of the recent declines may reflect the labour shortages that arose after the pandemic. Employers may need to respond by filling some vacancies with less skilled, lower paid workers. The increase in the share of immigrant workers (who typically earn lower wages than local workers) in euro area employment, from 7.9% in the fourth quarter of 2019 to 8.6% in the fourth quarter of 2022, may have also contributed to the overall decline in the wage share.
Chart B
The wage share in the main economic sub-sectors in the euro area
(percentages of gross value added,)
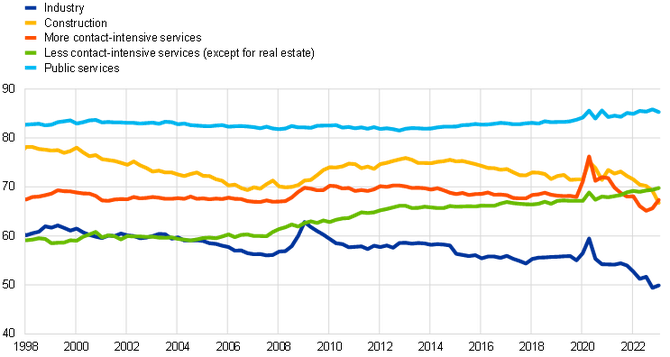
Sources: Eurostat and ECB staff calculations.
Notes: The latest observations are for the first quarter of 2023. More contact-intensive services include trade, transport, accommodation and other services. Less contact-intensive services sectors include information and communication, finance and insurance, and professional and administrative services.
Shifts in economic activity between sectors did not play a role in the most recent decline in the aggregate wage share observed in the euro area. Changes in the aggregate wage share can be caused by sectoral changes where sectors with a traditionally lower (or higher) wage share make a larger contribution to overall value added. However, a shift-share analysis finds that a shift in weights of value added across the main sectors towards those with a lower wage share contributed only marginally – by -0.1 percentage points – to the decline in the wage share. Instead, the decline is mostly explained by declines within sub-sectors, which contributed -0.6 percentage points to the overall decline in the wage share since the last quarter of 2019.[8]
Declining real consumer wages reflect the lower wage share and deteriorating terms of trade, but the impact of real wage losses on household incomes has been partly mitigated by fiscal support measures. Real consumer wages have declined since the start of the war in Ukraine, implying that part of the recent terms of trade shock and its impact on consumer price inflation is being absorbed by workers (Chart C). In the first quarter of 2023, real wages showed some partial recovery. While the decomposition of real wages into the wage share, terms of trade and productivity growth is mechanical and cannot take into account the endogeneity of these developments (for example, between the wage share and productivity growth), it still illustrates the confluence of developments in the wage share and real wage growth in recent quarters. On one hand, this reflects staggered wage negotiations, which mean wages adjust more slowly than prices and profits. On the other hand, some government support measures – amounting to 1.9% of GDP in the euro area in 2022 – limited the impact of high (primarily energy) inflation on low-income households and mitigated the income impact of real wage losses.[9] This support may have helped to counteract both the volatility in the real economy and the impact of high inflation. Thus, the decline in the wage share is likely to overstate the actual change in the income distribution. As headline inflation is declining, nominal wage growth is strengthening, and profits can be expected to absorb the ensuing unit labour cost growth, the wage share can be expected to further recover to a value closer to its pre-pandemic longer-term average.[10]
Chart C
The wage share and real consumer wages in the euro area
(annual percentage growth rates and percentage point contributions)
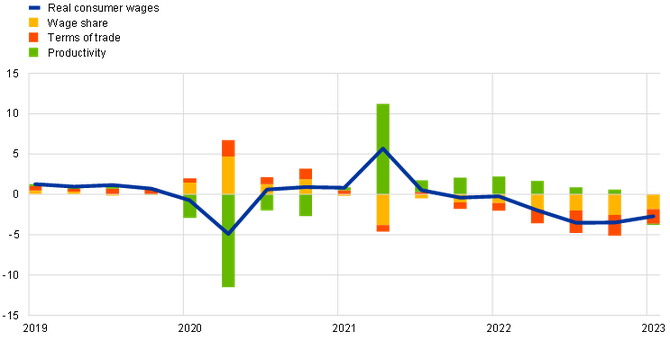
Sources: Eurostat and ECB staff calculations.
Notes: The latest observations are for the first quarter of 2023. “Terms of trade” is defined here as the ratio of the value added deflator to the private consumption deflator. The latter incorporates the prices of imported goods and services, while the value added deflator does not.
-
The correction for the self-employed in the numerator assumes that they earn the same labour income on average per person as employees in their respective sector. The denominator “gross nominal value added” consists of the sum of the domestic factor incomes (compensation of employees, gross operating surplus and mixed income), consumption of fixed capital (or depreciation) and “other taxes minus subsidies on production”. It is identical to “gross domestic product at basic prices”. References to business sectors refer to all NACE sectors, including the public services sector. The latter comprises public administration, defence, education and health. By definition, the wage share in the institutional government sector is 100%. This is because government services are not, or only to a marginal extent, sold in markets, so it is not possible to calculate the wage share of the institutional government sector.
-
For recent developments in profit margins, see the box entitled “How have profits contributed to the recent strengthening of euro area price pressures?” in this issue of the Economic Bulletin.
-
See, for example, Guschanski, A. and Onaran, Ö., “The decline in the wage share: falling bargaining power of labour or technological progress? Industry-level evidence from the OECD”, Socio-Economic Review, Vol. 20, Issue 3, July 2022, pp. 1091-1124; and Velasquez, A., “Production Technology, Market Power, and the Decline of the Labor Share”, IMF Working Paper, No 23/32, International Monetary Fund, February 2023.
-
See the article entitled “Wage developments and their determinants since the start of the pandemic”, Economic Bulletin, Issue 8, ECB, 2022; the box entitled “Developments in compensation per hour and per employee since the start of the COVID-19 pandemic” in the article entitled “The impact of the COVID-19 pandemic on the euro area labour market”, Economic Bulletin, Issue 8, ECB, 2020; and the box entitled “Short-time work schemes and their effects on wages and disposable income”, Economic Bulletin, Issue 4, ECB, 2020.
-
See “The Labor Share in Europe and the United States during and after the Great Recession”, World Economic Outlook, International Monetary Fund, April 2012, pp. 36-37.
-
The wage share in the market economy alone, i.e. excluding public services, has declined by 1.2 percentage points since the fourth quarter of 2019. Between the fourth quarter of 2019 and the first quarter of 2023, compensation per employee in the public sector and the less contact-intensive sectors increased by 9.5% and 12.4%, respectively, while in the total economy it increased by 11.3%. The number of employees also increased strongly in these broad sectors, by 4.8% and 6.1%, respectively, while in the total economy it increased by 3.1%.
-
For empirical evidence of outsourcing of services, see Baker, P., Foster-McGregor, N., Koenen, J., Leitner, S.M., Schricker, J., Stehrer, R., Strobel, T., Vermeulen, J., Vieweg, H.-G. and Yagafarova, A., “The Relation between Industry and Services in Terms of Productivity and Value Creation”, wiiw Research Report, No 404, The Vienna Institute for International Economic Studies, July 2015; Falk, M. and Peng, F., “The increasing service intensity of European manufacturing”, The Service Industries Journal, Vol. 33(15-16), 2013, pp. 1686-1706; and Schettkat, R. and Yocarini, L., “The shift to services employment: A review of the literature”, Structural Change and Economic Dynamics, Vol. 17(2), June 2006, pp. 127-147. For the overall mixed empirical evidence of the long-run effects of digitalisation and automation on wages and the wage share, which seem to be largely mediated by the structure of the economy and its labour market institutions, see Work stream on digitalisation, “Digitalisation: channels, impacts and implications for monetary policy in the euro area”, Occasional Paper Series, No 266, ECB, September 2021.
-
A further negative contribution of about -0.2 percentage points came from a residual component, reflecting a negative correlation between sectoral levels of the wage share and their respective changes. The calculation follows the shift-share analysis of productivity in Denis, C., McMorrow, K. and Röger, W., “An analysis of EU and US productivity developments (a total economy and industry level perspective)”, European Economy – Economic Papers, No 208, European Commission, July 2004, p. 78.
-
See the box entitled “Who foots the bill? The uneven impact of the recent energy price shock”, Economic Bulletin, Issue 2, ECB, 2023; and the box entitled “Update on euro area fiscal policy responses to the energy crisis and high inflation”, Economic Bulletin, Issue 2, ECB, 2023.
-
See the box entitled “How have profits contributed to the recent strengthening of euro area price pressures?” in this issue of the Economic Bulletin.

