The great retrenchment in euro area external financial flows in 2022 – insights from more granular balance of payments statistics
The great retrenchment in euro area external financial flows in 2022 – insights from more granular balance of payments statistics
Prepared by Lorenz Emter, Mariadolores Schiavone, Martin Schmitz
Published as part of the ECB Economic Bulletin, Issue 4/2023.
This box provides an analysis of the retrenchment in euro area external financial flows in 2022 – the largest since the global financial crisis – making use of new breakdowns of the euro area balance of payments and international investment position statistics.[1] A major development in 2022 was the shift in the euro area current account balance to a deficit of €137 billion (-1.0% of GDP) after a surplus of €285 billion (2.3% of GDP) in 2021. This constituted the biggest annual change in the euro area current account balance on record.[2] In the same period the financial account surplus fell from €312 billion to €14 billion, amid a sharp reversal in euro area financial flows on both the asset and the liability side. The analysis of the financial account has become increasingly complicated in recent years owing to the expansion of international financial intermediation chains, which often involve non-bank entities located in international financial centres.[3] As recommended in the international statistical manuals, the ECB has developed new breakdowns of the euro area balance of payments and international investment position statistics to facilitate enhanced analysis of risk exposures and interconnectedness.[4]
The sharp retrenchment in euro area external financial flows in 2022 was mainly driven by developments in portfolio investment and foreign direct investment (Chart A). In 2022 euro area investors’ net transactions in non-euro area assets reversed from a multi-year peak recorded in 2021 (net investment of €1.4 trillion) to net disinvestment of €0.3 trillion in 2022. This sharp reversal in financial flows on the euro area asset side was mainly due to developments in portfolio equity (listed shares and investment fund shares) and portfolio debt. Moreover, foreign direct investment (FDI) flows contributed notably to the retrenchment following a period of uncharacteristically high volatility in recent years.[5] Similarly, on the liability side, non-euro area investors turned from being net buyers of euro area assets in 2021 to being net sellers in 2022. The largest net disinvestments occurred in FDI, while net purchases of euro area portfolio equity securities dried up almost completely, following a record high in 2021. At the same time, net sales of euro area debt securities by foreign investors declined in 2022, following several years of strong net disinvestments.[6] Overall, the net sales observed for both assets and liabilities and the reversal in financial transactions in 2022 were the strongest recorded since 2009. The remainder of this box focuses on the main drivers of the retrenchment – portfolio investment and FDI – in more detail.
Chart A
Euro area financial account
a) Assets
(four-quarter moving sums, EUR billions)
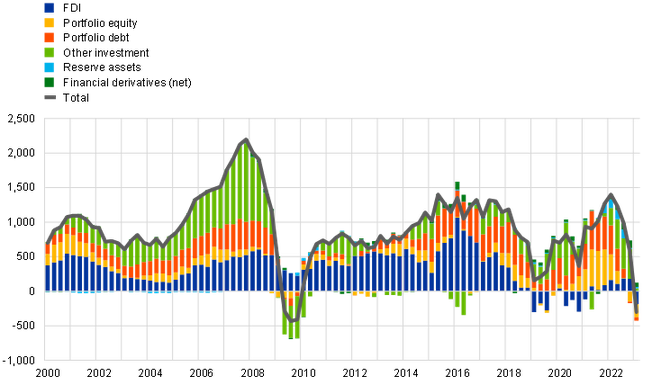
b) Liabilities
(four-quarter moving sums, EUR billions)
Source: ECB.
Notes: For assets, a positive (negative) number indicates net purchases (sales) of non-euro area instruments by euro area investors. For liabilities, a positive (negative) number indicates net purchases (sales) of euro area instruments by non-euro area investors. The latest observation is for the fourth quarter of 2022.
Euro area investors’ retrenchment from portfolio investment assets in 2022 was mainly driven by investment funds – which tend to be procyclical investors – while insurance corporations and pension funds offset the reversal in outflows to some extent (Chart B). The newly available series in the euro area balance of payments and international investment position statistics provide a breakdown of the non-bank financial intermediaries sector.[7] The breakdown reveals, in particular, the importance of euro area investment funds as holders of portfolio investment securities issued by non-euro area residents (accounting for 59% of total equity and debt holdings at the end of 2022).[8] In line with this, the change in the euro area portfolio investment pattern from net purchases (€790 billion in 2021) to net sales (€235 billion in 2022) of debt and equity securities was driven to a large extent by the investment fund sector. Generally, investment funds tend to be procyclical investors, i.e. they sell securities in periods of high risk aversion, thereby inducing volatility in financial flows, while insurance corporations and pension funds tend to act countercyclically, in line with the patterns observed for the euro area in 2022.[9] Moreover, the shifts in investment patterns in 2022 marked an end to a protracted phase of large-scale portfolio rebalancing towards extra-euro area securities that began in 2014 when the ECB introduced negative interest rates and launched its asset purchase programmes.[10]
Chart B
Euro area financial account: selected items by resident sector
(four-quarter sums, EUR billions)

Source: ECB.
Notes: For assets, a positive (negative) number indicates net purchases (sales) of non-euro area instruments by euro area investors. For liabilities, a positive (negative) number indicates net purchases (sales) of euro area instruments by non-euro area investors. The latest observation is for the fourth quarter of 2022. The abbreviation “NPISHs” stands for non-profit institutions serving households.
Geographically, the portfolio investment retrenchment in 2022 was mainly concentrated on securities issued by advanced economies in the case of equity, while for debt securities it was most pronounced for those issued by emerging market economies, in line with deteriorating global investor sentiment (Chart C). The new breakdown of the euro area’s counterpart countries allows for a better coverage of both advanced economies (with the addition of Australia, Norway and South Korea) and emerging market economies (now also including Argentina, Indonesia, Mexico, Saudi Arabia, South Africa and Türkiye). These new statistics reveal that euro area investors reduced their exposure to equity securities issued by residents of the United States, the United Kingdom and other advanced economies in 2022. For debt securities the picture is more nuanced: euro area investors on balance sold a significant amount of securities issued by residents of emerging market economies, offshore financial centres and the United Kingdom. Among emerging market economies, these net sales were driven by disinvestments of securities issued in China, Mexico and Russia.[11] In addition, the net sales of securities issued by offshore financial centres are likely to consist mostly of securities issued by subsidiaries of corporations based in emerging markets, in particular China.[12] At the same time, euro area investors made sizeable net purchases of securities issued by other advanced economies, in particular by residents of Canada and Japan, possibly driven by a stronger preference for safe assets.
Chart C
Euro area financial account: selected items by counterpart location
(four-quarter sums, EUR billions)

Source: ECB.
Notes: For assets, a positive (negative) number indicates net purchases (sales) of non-euro area instruments by euro area investors. For liabilities, a positive (negative) number indicates net purchases (sales) of euro area instruments by non-euro area investors. “EU non-EA” comprises the non-euro area EU Member States and those EU institutions and bodies that are considered for statistical purposes as being outside the euro area, such as the European Commission and the European Investment Bank. “Other advanced economies” include Australia, Canada, Japan, Norway, South Korea and Switzerland. Emerging economies include Argentina, Brazil, China, India, Indonesia, Mexico, Russia, Saudi Arabia, South Africa and Türkiye. “Other countries” include all countries and country groups not shown in the chart, as well as unallocated transactions. The latest observation is for the fourth quarter of 2022.
As regards foreign portfolio investment in the euro area in 2022,net purchases of euro area investment fund shares dried up, while foreign investors’ appetite for euro area debt securities picked up as the ECB’s monetary policy stance tightened (Chart B). Mirroring the reversal on the asset side of euro area investment funds, investors from outside the euro area turned into net sellers of shares issued by euro area investment funds amid the lower risk appetite prevailing in global financial markets following the outbreak of the war in Ukraine. The combination of the sizeable euro area investment fund industry and the strong extra-euro area investor base – especially for those funds based in Ireland and Luxembourg – had a large impact on euro area financial flows in 2022.[13] At the same time, foreign investors’ sentiment regarding euro area debt securities improved in 2022. While the period since 2015 was marked by high net sales of euro area debt securities (in particular of government bonds, partly reflecting the important role of non-residents as counterparts to the Eurosystem asset purchase programmes), net sales abated in 2022 as the key ECB interest rates started to rise and the Eurosystem discontinued net asset purchases. In an environment of rising interest rates, extra-euro area investors became net buyers of debt securities issued by entities in the euro area other financial institutions (OFI) sector, which include financial vehicle corporations, following net sales in previous years.
The retrenchment in FDI mainly reflected transactions by multinational enterprises in euro area financial centres, often linked to special-purpose entities, while FDI transactions of the non-financial corporate sector – which are more closely related to the real economy – remained more stable (Chart B).[14] On the euro area liability side, foreign direct investors’ disinvestments amounted to €317 billion in 2022 (2.4% of euro area GDP). These disinvestments were driven by investors resident in the United States and the United Kingdom, as well as those in offshore financial centres (Chart C), and took place exclusively vis-a-vis the OFI sector (€403 billion), which includes special-purpose entities such as holding companies.[15] In contrast to these more volatile “financialised” FDI flows, FDI in euro area non-financial corporations continued at a steady pace, recording €74 billion in net investments (Chart B). Turning to net acquisitions of FDI assets by euro area residents, the observed retrenchment was also predominantly driven by the OFI sector. The strong positive correlation between gross FDI asset and liability transactions related to OFIs suggests that these flows often “pass through” without being absorbed in the domestic economy. The retrenchment in FDI assets was largely driven by transactions vis-a-vis the United Kingdom related to the corporate restructuring of a single multinational enterprise.[16] The additional breakdowns included in the euro area balance of payments and international investment position statistics highlight that economic analysis of FDI benefits from a more detailed separation of “financialised” flows.[17]
-
The new data reported in accordance with the amended ECB External Statistics Guideline ECB/2018/19 include additional breakdowns by resident sector, counterpart country and foreign direct investment debt instruments. The new series are currently available as of the first quarter of 2019 and further back data will be made available in the course of 2024. Further information on the euro area balance of payments and international investment position statistics is available on the ECB’s website.
-
See the latest ECB statistical release on the Euro area quarterly balance of payments and international investment position.
-
Lane, P.R., “The analytical contribution of external statistics: addressing the challenges”, keynote speech at the Joint European Central Bank, Irving Fisher Committee and Banco de Portugal conference on “Bridging measurement challenges and analytical needs of external statistics: evolution or revolution?”, 17 February 2020; and Coppola, A., Maggiori, M., Neiman, B. and Schreger, J., “Redrawing the Map of Global Capital Flows: The Role of Cross-Border Financing and Tax Havens”, The Quarterly Journal of Economics, Vol. 136(3), 2021, pp.1499-1556.
-
International Monetary Fund Balance of Payments and International Investment Position Manual, sixth edition (BPM6). For recent data on financial transactions between euro area sectors, see the latest ECB statistical release on Euro area economic and financial developments by institutional sector (in particular Table 1).
-
Foreign direct investment-related flows were traditionally considered to be the least volatile category of international capital flows. See, for example, Eichengreen, B., Gupta, P. and Masetti, O., “Are Capital Flows Fickle? Increasingly? And Does the Answer Still Depend on Type?”, Asian Economic Papers, Vol. 17(1), 2018, pp. 22–41. However, in recent years the strong role of multinational enterprises has been accompanied by increased volatility, especially for small open economies. See, for example, Di Nino, V., Habib, M. and Schmitz, M., “Multinational enterprises, financial centres and their implications for external imbalances: a euro area perspective”, Economic Bulletin, Issue 2, ECB, 2020.
-
Transactions in the category “other investment” also reversed from high positive values in 2022 – in particular on the liability side – mainly owing to a decline in the deposits of non-euro area residents held with the Eurosystem.
-
The new breakdown of the non-bank financial intermediaries sector includes separate data for investment funds, insurance corporations and pension funds, and other financial institutions.
-
The investment patterns of euro area investment funds are relevant to assess the exposures of the underlying investors in these funds, in particular pension funds, insurance corporations and households. See Carvalho, D. and Schmitz, M., “Shifts in the portfolio holdings of euro area investors in the midst of COVID-19: looking through investment funds”, Review of International Economics.
-
See Timmer, Y., “Cyclical investment behavior across financial institutions”, Journal of Financial Economics, Vol. 129, No 2, 2018, pp. 268-286.
-
The ECB’s asset purchase programme was initiated in mid-2014, while its pandemic emergency purchase programme was launched in March 2020. Net asset purchases under both programmes were discontinued in 2022. See Couré, B., “The international dimension of the ECB’s asset purchase programme”, speech given at the Foreign Exchange Contact Group meeting, 11 July 2017; Lane, P.R., “The international transmission of monetary policy”, keynote speech at the CEPR International Macroeconomics and Finance Programme Meeting, 14 November 2019; and Bergant, K., Fidora, M. and Schmitz, M., “International capital flows at the security level: evidence from the ECB’s Asset Purchase Programme”, Working Paper Series, No 2388, ECB, Frankfurt am Main, April 2020.
-
For details on how euro area investment in Russia evolved, see Emter, L., Fidora, M., Pastoris, F. and Schmitz, M., “Euro area linkages with Russia: latest insights from the balance of payments”, Economic Bulletin, Issue 7, ECB, 2022.
-
Recent research finds that euro area investment in emerging market corporate bonds is substantially larger once investment in issuance by offshore subsidiaries of emerging market corporations is taken into account. See Beck, R., Coppola, A., Lewis, A., Maggiori, M., Schmitz, M. and Schreger, J., “The Geography of Capital Allocation in the Euro Area, working paper available at SSRN; and Bergant, K., Milesi-Ferretti, G.M. and Schmitz, M., “Cross-Border Investment in Emerging Market Bonds: Stylized Facts and Security-Level Evidence from Europe”, CEPR Discussion Paper, No 17946, 2023.
-
See Beck, R., Coppola, A., Lewis, A., Maggiori, M., Schmitz, M. and Schreger, J., “The Geography of Capital Allocation in the Euro Area”, working paper available at SSRN.
-
For FDI, additional details going beyond the scope of this box were released for debt instruments broken down into debt securities; loans; and trade credits and advances.
-
In the period after the global financial crisis, investment (predominantly by investors resident in the United States) in holding companies (often special-purpose entities) resident in euro area financial centres became an increasingly large component of euro area FDI liability flows. See Lane, P.R., “The analytical contribution of external statistics: addressing the challenges”, keynote speech at the Joint European Central Bank, Irving Fisher Committee and Banco de Portugal conference on “Bridging measurement challenges and analytical needs of external statistics: evolution or revolution?”, 17 February 2020.
-
Such large transactions are often related to corporate restructurings of a small number of multinational enterprises with a presence in financial centres in the euro area, but they can have a notable impact on global FDI flows. For example, global FDI flows dropped by 24% in 2022 compared with the previous year, but only by 5% when transactions involving Luxembourg are excluded. According to data from “FDI in Figures”, OECD, April 2023, the large disinvestment in Luxembourg mainly reflected an operation by an individual multinational telecommunications enterprise.
-
Such analysis will be further enhanced with the publication of euro area balance of payments and international investment position statistics with a separate breakdown for special-purpose entities, which is currently planned for the first half of 2024.

