How have unit profits contributed to the recent strengthening of euro area domestic price pressures?
How have unit profits contributed to the recent strengthening of euro area domestic price pressures?
Prepared by Elke Hahn
Profits are an integral component of output prices, just like production costs such as wages or the cost of intermediate inputs. Firms determine their desired profits by setting prices at a certain level in excess of costs in order to achieve remuneration on their capital. Developments in profits and wages, as captured by the GDP deflator, are important determinants of underlying inflation, as illustrated by the strong co-movement between the GDP deflator and indicators of underlying inflation such as the Harmonised Index of Consumer Prices (HICP) excluding energy and food, or HICP excluding energy (Chart A).[1] This box analyses the impact that profits have had on domestic inflation on the basis of unit profits derived from the national accounts.[2],[3] It also looks at how profit indicators derived from institutional sector accounts, which are closer to business profits, have contributed to domestic inflation, and how the current signals from unit profits based on the national accounts fit together with the signals from mark-ups and profit margin indicators derived from corporate accounts.
Chart A
Domestic price pressures and selected indicators of underlying inflation
(annual percentage changes; quarterly data)
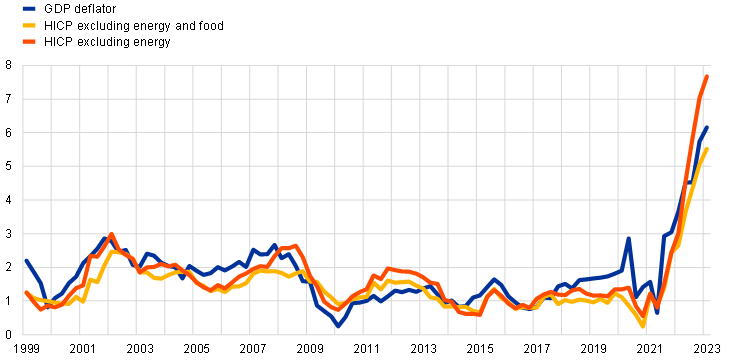
Sources: Eurostat and ECB calculations.
Note: The last observations relate to the first quarter of 2023.
Profit measures differ in terms of their scope and objectives. In the national accounts, the role of profits in domestic price pressures is analysed using unit profits, which are defined as gross operating surplus (GOS) and mixed income per unit of real GDP. ECB estimates allow this measure to be derived also for the non-financial corporation (NFC) sector. A further profit measure available in the national accounts for inflation analysis is the so-called profit margin indicator, which is calculated as the ratio of the GDP deflator at basic prices to unit labour costs. This assesses the extent to which profit developments have added to or mitigated unit labour cost developments in explaining domestic price pressures. Two profit measures that can be derived from corporate accounts are the mark-up and the profit margin. The mark-up is defined as the ratio of prices to marginal costs, whereby the latter are, in practice, typically proxied using average costs. This indicator can be used to assess firms’ pricing strategies. A commonly used indicator of profit margins derived from companies’ profit and loss accounting schemes in the context of the cost of sales method is the gross profit margin. This is calculated as gross profits divided by turnover, where gross profits are defined as turnover minus the cost of goods sold (i.e. minus the cost of materials and labour, among other things).
Unit profits can be affected by developments in intermediate consumption. GDP is based on the concept of value added. It includes the contributions made by profits (defined as GOS and mixed income) and the compensation of employees, as well as taxes (net of subsidies) on production, but it does not, by contrast with gross output, include intermediate consumption (such as that of energy or materials).[4] However, as intermediate consumption is already deducted in full from GDP, developments in profits can provide indications of the extent to which a change in intermediate consumption costs is reflected in the output price. Abstracting from other impacts on unit profits, if a situation involving large increases in intermediate consumption costs (as observed over the past two years) also sees a weakening of developments in unit profits, this is an indication that profits have (in part or in full) buffered the cost increase so that it is not transmitted (or not transmitted in full) to the output price. If, in contrast, developments in unit profits remain broadly unchanged or even strengthen in such a situation, this suggests that the output price has been increased by the same amount as the cost increase, or even more.
Domestic price pressures, as measured by the GDP deflator, have picked up strongly since mid-2021, with large contributions from both unit labour costs and unit profits. In the first quarter of 2023, the annual growth rate of the euro area GDP deflator reached a record high of 6.2%, up from 5.7% in the previous quarter, having stood at a low of 0.6% in the second quarter of 2021 (Chart B). Its average between 1999 and 2019 (i.e. in the period prior to the coronavirus (COVID-19) crisis) was 1.6%. As Chart B shows, unit labour costs and unit profits have both contributed to the increase in the GDP deflator over the past year and a half. The contribution from unit profits has been particularly large over the last three quarters, accounting for roughly 60% of total growth in the GDP deflator (which is higher than the 42% share of nominal GDP for GOS and mixed income).[5] The contribution that subsidies make to the GDP deflator was uniquely large during the COVID-19 crisis on account of government support related to job retention schemes, but unusually large contributions have also been observed more recently on account of government support during the energy crisis.
Chart B
GDP deflator and contributions
(annual percentage changes and percentage point contributions)
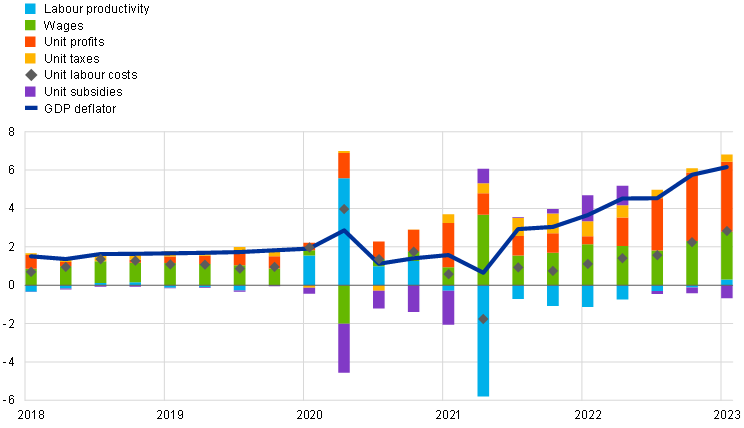
Sources: Eurostat and ECB calculations.
Note: The last observations relate to the first quarter of 2023.
The GOS and mixed income that are used in the unit profit indicator reflect a broad concept of profits. GOS covers all institutional sectors, while mixed income relates to the household sector (which also includes unincorporated businesses). Mixed income can be seen as the profits of the self-employed or unincorporated businesses after they have incurred their various costs. However, these profits still include compensation for the labour input of the self-employed. A common way of correcting for the labour income that is included in mixed income involves assuming that the self-employed earn the same average wage as employees and subtracting this imputed labour income from the GOS and mixed income component.[6] GOS and mixed income also include income from housing services (i.e. rents, which affect all institutional sectors in the economy, and imputed rents for owner-occupied housing, which only affect the household sector). Income from self-employment and housing is not typically regarded as forming part of business profits.[7] Another element of the GOS and mixed income component that is worth mentioning in this context is the consumption of fixed capital. This represents capital income that has been earned, but it can also be seen as a cost faced by companies, as it is needed to replace depreciated capital. Consequently, a better proxy for business profits is the gross or net operating surplus of NFCs in sectoral accounts, whereby the net figure is calculated as NFCs’ gross operating surplus minus consumption of fixed capital. A final point when it comes to determining what constitute profits relates to the impact of subsidies (as included in the taxes less subsidies component of GDP). Depending on the addressee, such subsidies are included in profits or labour income and netted out in the decomposition of the GDP deflator via the subsidies component. The COVID-19 and energy crises have resulted in exceptionally large subsidies over the past few years, as government support via job retention schemes and in relation to the energy crisis has, in part, been provided through subsidies. Subsidies have therefore had a visible impact on the labour and profit components over the past few years.[8] Such subsidies paid to firms clearly need to be distinguished from business profits. Nevertheless, any additional funding via subsidies could, in principle, have an impact on firms’ plans to adjust their prices.
Sectoral data suggest that developments in the gross and net operating surpluses of NFCs have been an important driver of the recent strength in overall unit profits. As outlined above, NFCs’ gross and net operating surpluses are closer to business profits than the GOS and mixed income component, which relates to the whole economy. Chart C shows the contributions that NFCs’ net operating surplus, NFCs’ consumption of fixed capital and other income make to unit profits for the whole economy as displayed in Chart B. That decomposition shows that, while all three components have strengthened over the past few quarters, NFCs’ gross and net operating surpluses have recently been more dynamic than overall unit profits and have been important drivers of the pick-up in unit profits.[9] Their contribution to the increasingly strong growth of the GDP deflator in the second half of 2022 was noticeable. This shows that companies have, on aggregate, not buffered cost increases; indeed, it suggests that their price rises have exceeded the increases seen in costs, thereby contributing to the pick-up in domestic inflation.
Chart C
Breakdown of the contribution made by unit profits
(percentage point contributions)
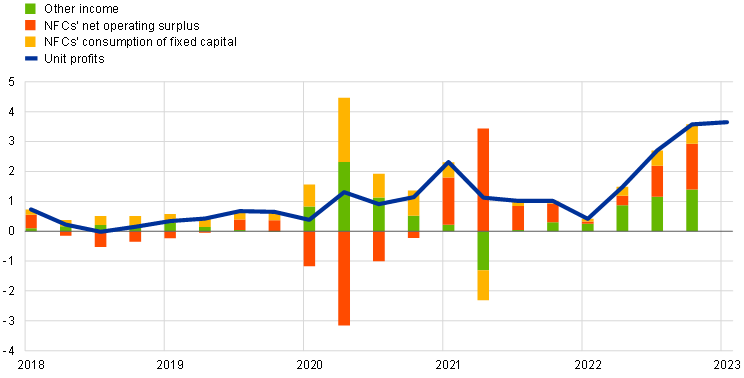
Sources: Eurostat and ECB calculations.
Note: The last observations relate to the first quarter of 2023 for unit profits and the fourth quarter of 2022 for the components.
Domestic price pressures in the NFC sector have outpaced those seen in the economy as a whole in recent quarters, reflecting strong growth in unit labour costs, as well as a disproportionately large contribution from unit operating surpluses (Chart D). The annual growth rate of the GDP deflator for the NFC sector rose to 7.2% in the fourth quarter of 2022, thereby exceeding domestic price pressures in the economy as a whole by 1.5 percentage points. This represents a deviation from historical regularities, as the growth rate of the GDP deflator for the NFC sector has typically been lower than the equivalent figure for the total economy.[10] The recent strong growth in the GDP deflator for the NFC sector has partly reflected strong growth in unit labour costs for that sector, the annual growth rate of which stood at 5.1% in the fourth quarter of 2022 (0.6 percentage points above the equivalent rate for the total economy). Notwithstanding these developments, gross and net operating surpluses made disproportionately large contributions to domestic price pressures in the NFC sector in the second half of 2022, accounting for nearly 50% of domestic price pressures in gross terms and somewhat more than 30% in net terms, clearly in excess of their respective shares of nominal GDP (about 40% and 20% respectively).
Chart D
GDP deflator for the NFC sector and contributions
(annual percentage changes and percentage point contributions)
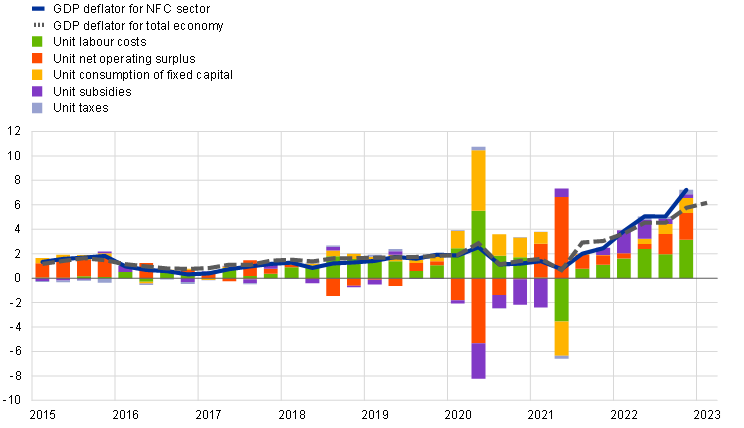
Sources: Eurostat, ECB and ECB calculations.
Note: The last observations relate to the first quarter of 2023 for the GDP deflator for the total economy and the fourth quarter of 2022 for all other data.
Traditional macroeconomic determinants would have pointed to much weaker developments in unit profits, which indicates that their recent growth has been driven mostly by less usual factors. Usually, unit profits are particularly influenced by the economic cycle and the terms of trade.[11] One might have expected that the cyclical slowdown in economic activity up to the first quarter of 2023 and the adverse developments in the terms of trade in 2022 would have dampened developments in unit profits. A first reason for the unusual strength of unit profits is the fact that demand has been outpacing supply in many sectors, with the pandemic generating widespread supply constraints and pent-up demand developing in its aftermath. A second reason is the fact that strong input price dynamics (for energy, for example) have made it easier for firms to raise prices, as in such a situation it is harder to tell whether a price increase has been caused by higher costs or higher unit profits.[12] Also, expectations of further strong increases in input prices could have motivated firms to bring price increases forward in order to smooth out price changes over time.[13] A further potential reason is the fact that the high-inflation environment triggered by the terms of trade shock has resulted in a significant decline in real income for the domestic economy, with workers and companies possibly aiming to recoup those losses.
The role that (business) profits play in inflation has recently also been assessed on the basis of estimated mark-ups and profit margins derived from corporate accounts. While other studies based on profit and unit profit data taken from the national accounts corroborate findings in this box,[14] the fact that estimated mark-ups and profit margins derived from corporate accounts are broadly unchanged is often interpreted as suggesting that the role of profits is less clear as regards inflation.[15] However, comparisons of the underlying concepts and stylised examples of the ways in which these different indicators respond to an intermediate input cost shock show that their respective movements do in fact provide a consistent picture.
In a situation characterised by large increases in intermediate consumption costs, the broadly unchanged mark-ups observed are in fact consistent with increased inflationary pressures from unit profits. The role that profits play as regards inflation has recently attracted attention in economic literature, focusing on the question of whether it is possible to derive insights on firms’ behaviour from national accounts data. In microeconomic theory, firms are typically characterised as setting prices as a mark-up on their marginal costs. Consequently, price pressures can arise from both marginal costs and the mark-up. The latter is usually used to assess firms’ pricing strategies, which are considered to be unchanged if the mark-up is unchanged. In the presence of strong increases in costs, an unchanged mark-up implies similarly strong increases in unit profits. From a firm’s perspective, this unchanged mark-up may be seen as an unchanged pricing strategy and may, in this respect, not be regarded as actively contributing to inflationary pressures, since profits are simply displaying the same strong dynamics as overall costs. However, from a macroeconomic and inflation analysis perspective, any increase in a component of a price contributes to inflation, regardless of whether there has been a change in the underlying pricing behaviour.[16]
Table A provides stylised examples of developments in mark-ups and unit profits in response to an intermediate input cost shock. The table distinguishes, on the basis of a hypothetical cost structure, between a situation (Case 1) where the mark-up on total costs remains unchanged after the intermediate input cost shock and a situation (Case 2) where only the pure input cost increase is transferred to the output price (with the mark-up changing as a result). In Case 1, a 67% increase in input costs in period T1 implies a 33% increase in total costs. If an unchanged mark-up of 20% is applied on top of total costs, the firm’s profits and unit profits also rise by 33%, thereby adding to inflation alongside the initial input cost shock. In Case 2, input costs and total costs increase by the same amount as in Case 1, but only the pure increase in costs is transferred to the price, while profits are not adjusted in response to the input cost shock. In this situation, the price increases by less than in Case 1 (28%), implying a decline in the mark-up. Profits and unit profits remain unchanged, so do not add to inflation. These examples show, therefore, that in the presence of an input cost shock, increases in unit profits and their contribution to inflation can be consistent with a constant mark-up and thus unchanged pricing behaviour. They also show that the mark-up must decline if unit profits are to remain unchanged in the face of an input cost shock.
Table A
Stylised example of developments in profit indicators in response to an input cost shock
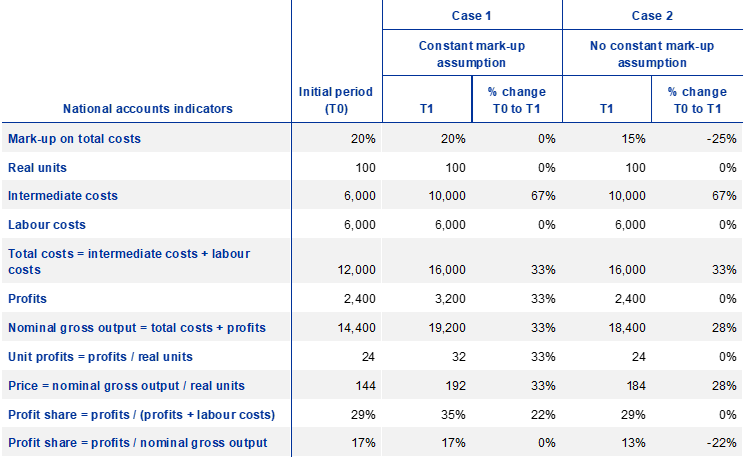
Source: ECB.
Note: In Case 1, the mark-up on total costs is assumed to remain constant; in Case 2, the calculation of the mark-up is based on an assumption that the price only reflects the additional input costs, not additional profits.
Similarly, in a situation characterised by surging input costs, unchanged gross profit margins in corporate accounts can also be consistent with increased inflationary pressures from profits. As noted above, a commonly used indicator of profit margins that can be derived from corporate accounts is the gross profit margin, which is defined as gross profits divided by turnover. Notwithstanding differences in terms of the underlying concept and data sources, the gross profit margin can broadly be regarded as the counterpart to the profit share (defined as the ratio of profits to nominal gross output) in the national accounts. On that basis, one can infer from Table A that the gross profit margin is unchanged in Case 1 (where the mark-up is constant), and this unchanged gross profit margin is consistent with increasing unit profits and inflationary pressures from profits. In Case 2 (where only the increased input costs are reflected in the price, with unit profits remaining unchanged) the gross profit margin declines, as gross profits are unchanged while turnover increases.
Overall, unit profits have grown strongly in recent quarters and made a visible contribution to domestic price pressures in the euro area, but they are expected to act as a buffer against some of the pass-through of increased labour costs. Strong growth has been seen not only for the broad indicator of unit profits based on GOS and mixed income, but also for more narrowly defined profit indicators available in the national accounts which are more closely linked to business profits. In the context of surging intermediate input costs, this picture of dynamic developments in unit profits and upward effects on inflation is consistent with the broadly unchanged mark-ups and gross profit margins seen in corporate accounts. Looking ahead, the unwinding of pent-up pandemic-related demand, the easing of supply bottlenecks and the dampening impact of monetary policy tightening should mean that firms are under more pressure to absorb strong wage growth and the ensuing growth in unit labour costs using unit profits.
-
This applies despite conceptual differences between the two types of measure. There are conceptual differences regarding the coverage of price pressures, for example, since the GDP deflator covers only components of value added, whereas indicators of underlying inflation comprise all components of the output price. Likewise, the GDP deflator captures price pressures in the domestic economy, whereas indicators such as HICP excluding energy and food relate to price developments in the consumer goods sectors in question, regardless of whether those goods or services are produced domestically or imported.
-
It should be noted that unit profits and business profits are conceptually different, as explained later in the box.
-
See also Arce, Ó., Hahn, E. and Koester, G., “How tit-for-tat inflation can make everyone poorer”, The ECB Blog, ECB, 30 March 2023.
-
A measure of gross output is available in input-output statistics. However, the lack of timeliness in the release of these data limits their application in policy analysis.
-
By contrast with Chart B, Chart 1 in Arce et al., op. cit., provides a breakdown of the GDP deflator including a correction for the income of the self-employed. Note that differences between the two as regards the contribution of unit profits are small.
-
This correction for the income of the self-employed is typically applied when deriving the standard contribution that profits make to the euro area GDP deflator. See, for example, Chart 1 in Arce et al., op. cit.
-
For a recent detailed discussion, see Haskel, J., “What’s driving inflation: wages, profits, or energy prices?”, speech given at the Peterson Institute for International Economics, Washington, DC, 25 May 2023.
-
Although subsidies relating to job retention schemes during the COVID-19 recession were primarily geared towards the stabilisation of labour income and were directly reflected in that income component, they also had a visible impact on the unit profit component, which was much more resilient than in previous recessions. While firms generally strive to retain their employees in the early stages of a downturn at the expense of unit profits, this downward pressure on unit profits appears to have been alleviated by the much more widespread use of job retention schemes in the context of the COVID-19 recession. See the box entitled “The role of profit margins in the adjustment to the COVID-19 shock”, Economic Bulletin, Issue 2, ECB, March 2021.
-
While NFCs’ gross and net operating surpluses account for 54% and 28% respectively of total GOS and mixed income for the whole economy, in the second half of 2022 they explained larger shares (almost 60% and more than 40% respectively) of the contribution made by unit profits. With shares in nominal GDP of roughly 23% and 12% respectively, NFCs’ gross and net operating surpluses accounted for roughly 36% and 25% respectively of total growth in the GDP deflator.
-
Over the period from 2002 to 2021 (i.e. before the recent strong increases) the average growth rate of the GDP deflator for the NFC sector was 1.1%, compared with a rate of 1.6% for the economy as a whole. Note that the GDP deflator for the NFC sector is based on internal estimates by the ECB and is only available as of 2002.
-
See the box entitled “How do profits shape domestic price pressures in the euro area?”, Economic Bulletin, Issue 6, ECB, September 2019; and the box entitled “The role of profit margins in the adjustment to the COVID-19 shock”, Economic Bulletin, Issue 2, ECB, March 2021.
-
For evidence on the relationship between inflation and profit growth, see Andler, M. and Kovner, A., “Do corporate profits increase when inflation increases?”, Liberty Street Economics, Federal Reserve Bank of New York, 13 July 2022.
-
See Glover, A., Mustré-del-Río, J. and von Ende-Becker, A., “How Much Have Record Corporate Profits Contributed to Recent Inflation?”, Economic Review, Vol. 108, No 1, Federal Reserve Bank of Kansas City, first quarter of 2023.
-
See, for instance, Ragnitz, J., “Gewinninflation und Inflationsgewinner”, ifo Institute, 7 December 2022; Capolongo, A., Kühl, M. and Skovorodov, V., “Firms’ profits: cure or curse?”, ESM Blog, 12 May 2023; and European Commission, “Spring 2023 Economic Forecast: an improved outlook amid persistent challenges”, 15 May 2023.
-
See, for example, Colonna, F., Torrini, R. and Viviano, E., “The profit share and firm mark-up: how to interpret them?”, Occasional Paper No 770, Banca d’Italia, May 2023, on the question of mark-ups; and Schlautmann, C., “Inflation oder ‘Gierflation’ – Was sich von Grosskonzernen lernen lässt”, Handelsblatt, 11 May 2023, on profit margins derived from corporate accounts.
-
Colonna et al., op. cit., also show that changes in the profit share do not always match those in the mark-up – and that, like unit profits, the profit share cannot be regarded as an unambiguous indicator of changes in pricing behaviour.

