Risks to global food prices from El Niño. The almost certain arrival of an El Nino phenomenon towards the end of 2023 implies risks to global food commodity prices.
Risks to global food commodity prices from El Nino
Prepared by Jakob Feveile Adolfsen and Marie-Sophie Lappe
Published as part of the ECB Economic Bulletin, Issue 6/2023.
The almost certain arrival of an El Nino phenomenon towards the end of 2023 implies risks to global food commodity prices. In June, the US National Oceanic and Atmospheric Administration (NOAA) announced that El Nino conditions had arrived, with an El Nino episode likely to develop at the end of this year. An El Nino event is defined as taking place when the three-month rolling average of the ocean surface temperature in the East-Central tropical Pacific has stayed at least 0.5 degrees Celsius above the 30-year average for five consecutive, overlapping three-month periods in a row.[1] The latest weather forecast points to a 99% probability that an El Nino episode will emerge in the last quarter of 2023 and a 66% probability that it will be strong – with a temperature deviation of at least 1.0 degree Celsius above the 0.5-degree threshold defining an El Nino phenomenon (Chart A).[2] This year’s El Nino episode marks a departure from the previous three years, which were dominated by its colder counterpart, La Nina.[3] El Nino is likely to affect equatorial and global food supplies and prices as it affects weather developments around the globe. This box discusses the likely effects of the El Nino phenomenon on global food commodities and examines the risks to food commodity prices in case it develops into a strong El Nino. While the box focuses mainly on the impact of a strong El Nino, which might amplify the effects on food commodity prices next year, various studies show that the arrival of any El Nino conditions is likely to affect global food commodities, regardless of intensity.[4]
Chart A
Probabilities of an El Nino event in Q4 2023
(percentages)
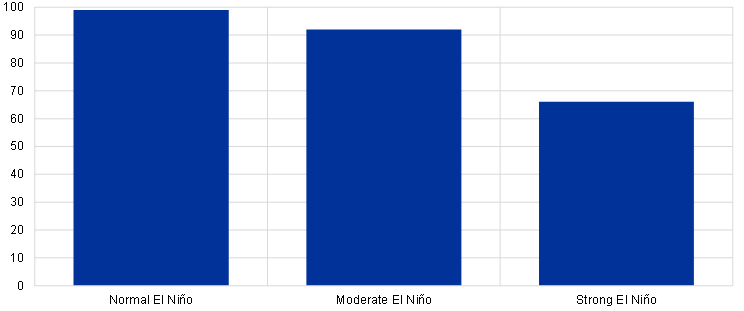
Source: US NOAA.
Notes: A normal El Nino event is defined by the NOAA as an increase in ocean surface temperatures of at least 0.5 degrees Celsius above the long-term average. A “moderate El Nino” and “strong El Nino” are defined as temperature increases of at least 1.0 and 1.5 degrees Celsius above the long-term average, respectively. The latest observations are for 10 August 2023.
Complex weather effects resulting from El Nino are likely to affect food crops around the globe, especially around the equator. El Nino is associated with a higher frequency of extreme weather events. These events differ significantly depending on the region. For example, El Nino typically leads to heatwaves with heavy rainfalls in South America and southern US states, while it leads to droughts in northern US states. The complexity of the resulting climate patterns implies that El Nino affects crop yields differently depending on crop types and growing seasons, as well as on the region in question. Effects on crop yields are also likely to vary between different El Nino cycles. Estimates of the historical effects of an El Nino phenomenon on crop yields illustrate how the impact differs across crop types, even within the same country. While an El Nino episode seems to be followed by higher soybean harvests in the United States, it usually has negative effects on US wheat and corn yields.[5] Moreover, while El Nino has historically had positive effects on soybean yields in the United States and South America, it tends to reduce soybean yields in Asia.[6] The complex effects make it challenging to predict the implications of El Nino for global food commodity prices. Substitution between food commodities further complicates price effects. To some extent, farmers perceive soybeans and corn as mutual substitutes and occasionally switch between the two crops depending on current futures prices. This implies that a potential reduction in corn yields could spill over to soybean prices, while the price effects for corn could be dampened somewhat by this substitution effect. Furthermore, the 1982-1983 El Nino episodes caused the fish population in Asia and Australia to fall, leading to a substitution in demand from fish to soybeans for animal feed.[7] Because of this complexity, and since crop yields are one of many factors that affect global food commodity prices, it would be misleading to directly extrapolate crop yield effects to price effects.
Historical analyses suggest that a normal El Nino has upward effects on global food commodity prices. Various studies examine the effect of El Nino on global food commodity prices. Brenner (2002) finds that the El Nino oscillation accounts for almost 20% of global commodity price inflation movements since 1963 and that a normal El Nino event tends to raise real commodity price inflation by around 3% for 6-12 months after its emergence, with the strongest contribution coming from food commodities.[8] Cashin et al. (2017) document variation in the impact of El Nino shocks since 1972 on economic activity across different countries, with most countries facing an increase in non-energy commodity prices.[9] Overall, they find that El Nino has an upward impact of around 5% on global non-energy commodity prices and that this impact lasts for 6-16 months.[10] Further findings suggest that inflation responds more strongly to an El Nino event in countries which have a higher weight of food in the inflation index. These studies suggest that an El Nino episode of any strength has significant effects on food commodity prices and that it generally raises prices.
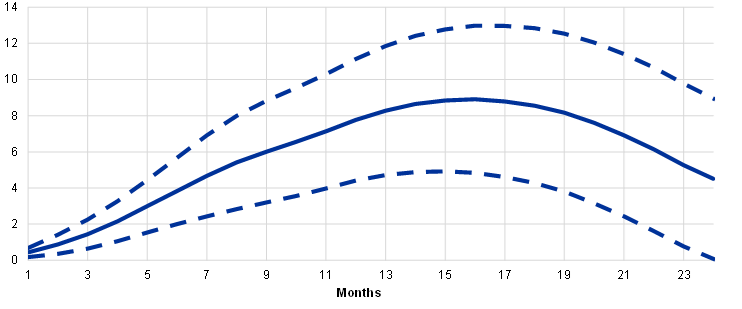
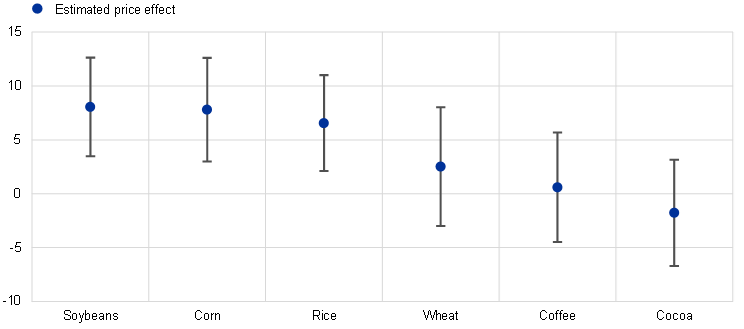
Global food commodity prices could rise by up to 9% if current El Nino conditions develop into a strong El Nino. While El Nino conditions have already arrived and it is almost certain that 2023 will be declared an El Nino year, there is higher uncertainty about the strength of the El Nino event.[11] Historical estimates, where developments in the global business cycle as well as in fertiliser and energy prices have been controlled for, suggest that a rise in ocean surface temperatures corresponding to the transition from a normal to a strong El Nino would raise global food commodity prices for up to two years, with a 9% peak in price increases occurring 16 months after the start of the strong El Nino episode (Chart B, panel a). This follows from the higher risks and potential amplifications of extreme weather events that a strong El Nino would imply relative to a normal El Nino. The upside risks to food commodity prices arising from the development of a strong El Nino phenomenon are particularly pronounced for soybeans, corn and rice, while the expected price effects are upwards but insignificant for wheat and around zero for coffee and cocoa (Chart B, panel b).
Chart B
Estimated global food commodity price effects of a transition from a normal to a strong El Nino
a) Price effects following the start of a strong El Nino period
(percentage changes)
b) Effects on prices of selected food commodities
(percentage changes)
Sources: Haver, US NOAA and ECB staff calculations.
Notes: Estimated price effect shows the impact of a 1.0-degree Celsius increase in ocean surface temperatures during El Nino phenomena, controlling for fertiliser and oil prices as input costs in food production and for global industrial activity as an indicator of the global business cycle. Impulse response functions have been estimated with local projections following Jorda, O., “Estimation and Inference of Impulse Responses by Local Projections”, Vol. 95, No 1, 2005, pp. 161-182. The charts show 68% confidence intervals. Panel b) shows the estimated price effect after 16 months, based on the peak reaction of the food commodity price aggregate in panel a). The latest observations are for April 2023.
Financial markets factor in future price increases but also higher price uncertainty. Incorporating El Nino developments improves the precision of forecasts on future food commodity price volatility.[12] This suggests that traders of commodity derivatives might incorporate the El Nino outlook when trading in the futures market. Focusing on the three main grain crops (soybeans, corn and wheat), futures prices increased in the week following the NOAA announcement on 8 June that El Nino conditions had arrived, together with a probability of around 50% assigned to the development of a strong El Nino phenomenon towards the end of the year (Chart C).[13] Both the level of prices and price uncertainty for soybeans and corn in the summer of 2024 increased significantly. Soybean prices increased by 12% and corn prices by 10%, while the standard deviation of the distributions increased by 24% and 23%, respectively. According to market analysts, these developments mainly reflected unfavourable weather developments in the northern hemisphere at the beginning of June, with the El Nino development imposing extra uncertainty on the outlook for crops. The impact on wheat, which has remained less sensitive to strong El Nino events historically, was smaller, with prices increasing by 7% and the standard deviation by 13%. Overall, changes in option-implied price distributions reflect potential upward pressures on food commodity prices and increases in price uncertainty triggered by ongoing El Nino developments.
Chart C
Option-implied price distributions before and after the announcement of El Nino
(x-axes: USD per bushel; y-axes: percentages)
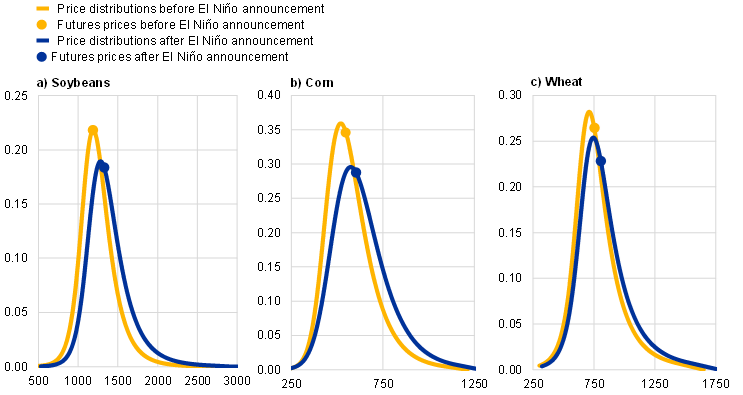
Notes: Option-implied risk-neutral distributions are calculated following Black, F. and Scholes, M., “The Pricing of Options and Corporate Liabilities”, Journal of Political Economy, Vol. 81, No 3, 1973, pp. 637-654, based on the Chicago Board of Trade’s July 2024 futures for soybeans, corn and hard red winter wheat. Overnight index swap rates are used as input for the risk-free interest rate. Price uncertainty is measured by the width of the option-implied distributions. The cut-off dates for before and after the El Nino announcement were 7 June 2023 and 16 June 2023, respectively.
-
Following the NOAA definition, El Nino is the warm phase of the oscillation in the equatorial Pacific Ocean (also called El Nino–Southern Oscillation). In the neutral phase of the oscillation, trade winds, which are the permanent winds that blow from east to west around the equator, push warm water from South America to Asia, where it evaporates more easily. This generates the upwelling process, which is when deep, cold water rises to the ocean surface to replace warm water. During El Nino, trade winds slow down and warm water is pushed back towards South America, which causes the upwelling process to weaken or even stop.
-
Historically, strong episodes have accounted for 8 out of the 23 El Nino episodes since 1950.
-
The definition of La Nina is similar to the El Nino definition, but with negative anomalies in ocean surface temperatures. A La Nina phase is generated by trade winds that are stronger than usual, which amplifies the upwelling process.
-
This box focuses on international food commodity prices and not on euro area consumer food prices, where the effects are expected to be smaller. Peersman (2022) shows that changes in international food commodity prices explain almost 30% of volatility in euro area inflation over the medium term. See Peersman, G., “International Food Commodity Prices and Missing (Dis)Inflation in the Euro Area”, The Review of Economics and Statistics, Vol. 104, No 1, 2022, pp. 85-100. Subsidies granted to domestic producers through the EU’s Common Agricultural Policy partially mitigate the effects of changes in international food commodity prices on euro area consumer food prices. See, for example, Ferrucci, G., Jiménez-Rodríguez, R. and Onorante, L., “Food Price Pass-Through in the Euro Area: Non-linearities and the Role of the Common Agricultural Policy”, International Journal of Central Banking, Vol. 8, No 1, 2012, pp. 179-217.
-
Soybean crops in the United States benefited mainly from favourable summer growing conditions in the Midwest, while heatwaves and droughts damaged crops in Asia. Corn crops in the United States were mainly negatively affected by the dry conditions in Southeastern states that tend to follow from El Nino.
-
Based on Iizumi, T., Luo, J.J., Challinor, A.J., Sakurai, G., Yokozawa, M., Sakuma, H., Brown, M.E and Yamagata, T., “Impacts of El Nino Southern Oscillation on the global yields of major crops”, Nature Communications, 5, No 3712, 2014.
-
See Brenner, A.D., “El Nino and World Primary Commodity Prices: Warm Water or Hot Air?”, The Review of Economics and Statistics, Vol. 84, No 1, 2002, pp. 176-183.
-
Brenner, A.D., op. cit.
-
Cashin, P., Mohaddes, K. and Raissi, M., “Fair weather or foul? The macroeconomic effects of El Nino”, Journal of International Economics, Vol. 106, 2017, pp. 37-54.
-
Cashin et al., ibid., use a measure not based on temperature, which does not allow for the classification of a normal or strong El Nino episode. In addition to the effect on food commodity prices, metal prices are also found to contribute to the increase in non-energy commodity prices, mainly because extreme weather events affect mining activity, as seen in Chile. See Cashin, P., Mohaddes, K. and Raissi, M., “El Nino: Good Boy or Bad?”, Finance and Development, Vol. 53, No 1, 2016, pp. 30-33.
-
1.0 degree Celsius is the difference between a normal (0.5 degrees Celsius anomaly) and a strong (1.5 degrees Celsius anomaly) El Nino event. For current El Nino probabilities, see Chart A.
-
Su et al. show that incorporating El Nino developments improves the forecasting of future price volatility in the US grain market. See Su, Y., Liang, C., Zhang, L. and Zeng, Q., “Uncover the response of the U.S grain commodity market on El Nino–Southern Oscillation”, International Review of Economics & Finance, Vol. 81, 2022, pp. 98-112.
-
Respective weights of soybeans, corn and wheat in the HWWI’s Index for Food and Beverages (based on EMU country imports): 14%, 14% and 8%.
|
|


Weather searching weather forecast for all cities in the world.
The second option is to search through list of continents and countries.
